Point and Segment Selection
Last Updated: 7/2/19 by Tim Paschkewitz

ARTICLE TAGS
-
point,
-
segment,
-
selection tool,
-
copy and paste,
-
quick export,
-
point selection,
-
segment selection
1Introduction
After obtaining electrochemical data, users often want to select only certain points of their data for further study. For an experiment in which more than one segment of the waveform was applied, users might also desire to simply select, copy, and export only a certain segment. AfterMath provides for this with only a few clicks. This article will cover point and segment selection and also quick copy/paste export of selected data to a spreadsheet.
2Point and Segment Selection
Navigate through the archive structure on the left and choose a plot node within the desired experiment. Doing so will display the plot on the right side of the screen (see Figure 1).
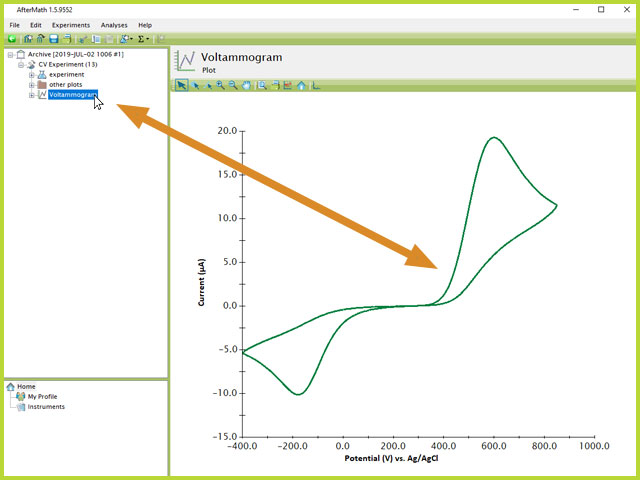
Figure 1. Plot Selection from Archive Tree in AfterMath
Next, right-click the trace on the plot to expose the right-click menu. Choose "Select points..." from the menu (see Figure 2).
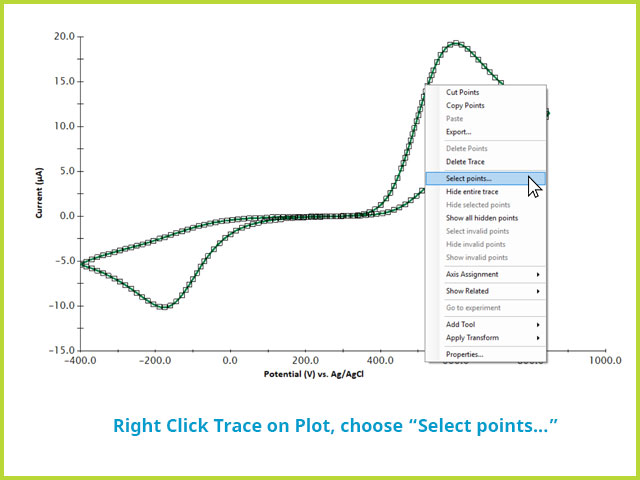
Figure 2. Choose Points Option from Right-Click Menu in AfterMath
After choose "Select points..." a dialog window will open with several options. First, select the radio button for Points or for Segments. When Points is chosen, the lower box in this window will display a series of points that you can manually select by ticking the box next to the label of the point. When Segments is chosen, each available segment will be shown in the lower box and can be selected by ticking the box next to the label of the segment (see Figure 3).
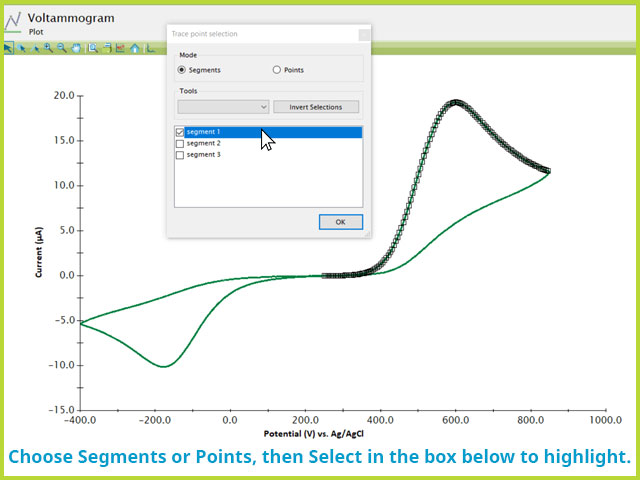
Figure 3. Point or Segment Selection Window in AfterMath
In the example above, the "Segments" radio button selection indicates that the cyclic voltammetry data trace on the plot consists of three segments, labeled segment 1, segment 2, and segment 3. For example, if the user wishes to only select the data points contained within segment one, tick the box next to the "segment 1" label. Upon making this selection, notice that the data points within segment one are highlighted on the underlying trace. Press OK when the desired points/segments have been selected.
NOTE: Points OR Segments can be selected, but not a combination of both at the same time. Multiple selection operations are required to select both segments and points from other segments.
Now with the desired points (or segments) have been selected, right-click the selected points and choose "Copy points." This puts the points onto the Windows clipboard.
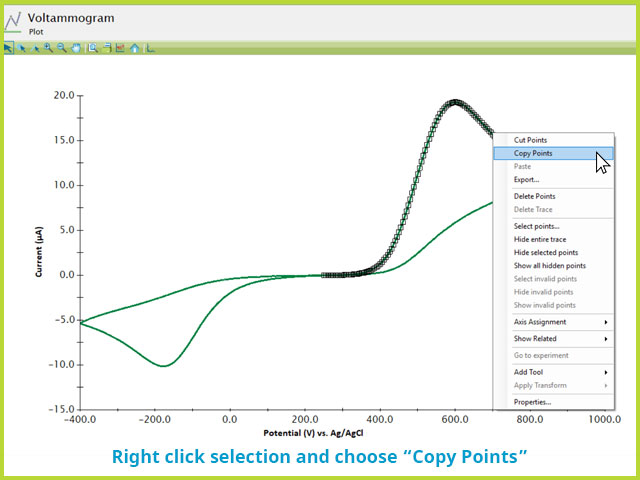
Figure 4. Copy Selected Points to Clipboard with Right-Click Menu in AfterMath
3Pasting Copied Points (Quick Export)
Users can "paste" the copied data points to any appropriate application on the computer. Common choices include pasting them onto a plot in AfterMath or into a spreadsheet program, also called "quick export." Here, pasting the selected data to a spreadsheet will be illustrated. Simply open a spreadsheet, select the cell where the data pasting should start, and select Paste (or click Ctrl+V) (see Figure 5).
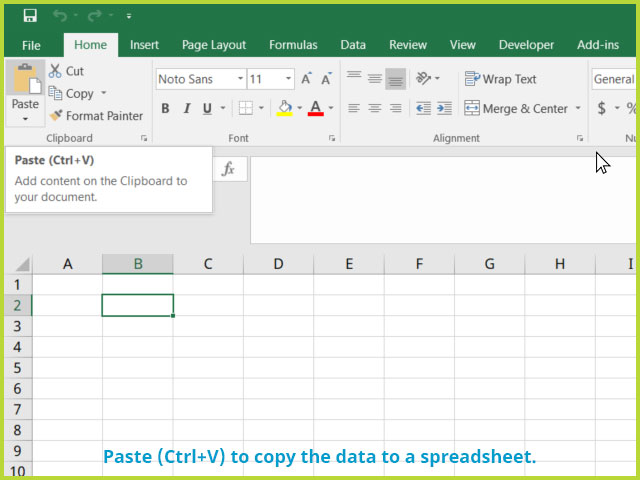
Figure 5. Quick Export Method of Copying and Pasting Data from AfterMath to a Spreadsheet Program
Make note (label) the columns and units as appropriate. The x-y data, selected and copied according to Section 1, are now available as text within the spreadsheet (see Figure 6).
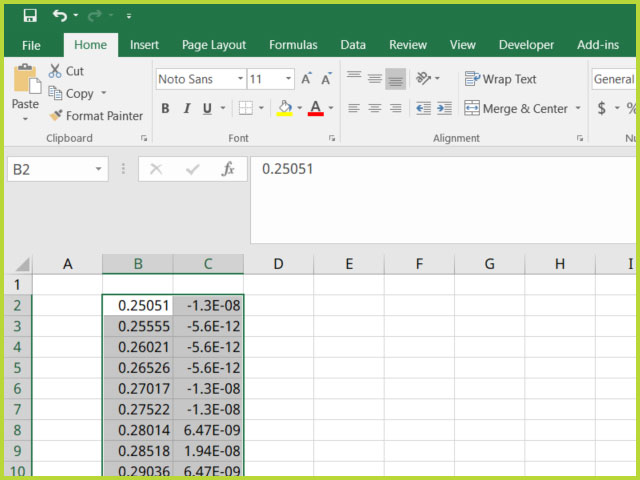
Figure 6. Quick Export of Selected Points/Segments in AfterMath to an External Spreadsheet (Quick Export)
This "quick export" method is quite powerful. While a more complete (and traditional) export method is available, users often comment that this unique feature in AFterMath is convenient to use.


