Voltammetry Plotting Conventions
Last Updated: 7/19/19 by Neil Spinner
1Plotting Conventions
The two streams of data recorded during a voltammetry experiment are the potential vs. time and the current vs. time. Rather than plot these two streams separately, it is more common to plot current vs. potential. Such a plot is called a voltammogram.
Although most electroanalytical researchers agree that current should be plotted along the vertical axis and potential should be plotted along the horizontal axis, there is no widespread agreement as to the orientation (direction) for each axis. Some researchers plot positive (anodic, oxidizing) potentials toward the right while others plot negative (cathodic, reducing) potentials toward the right (as per classical polarography tradition). Furthermore, some researchers plot anodic (oxidizing) current upward along the vertical axis, while others plot cathodic (reducing) current in the upward direction.
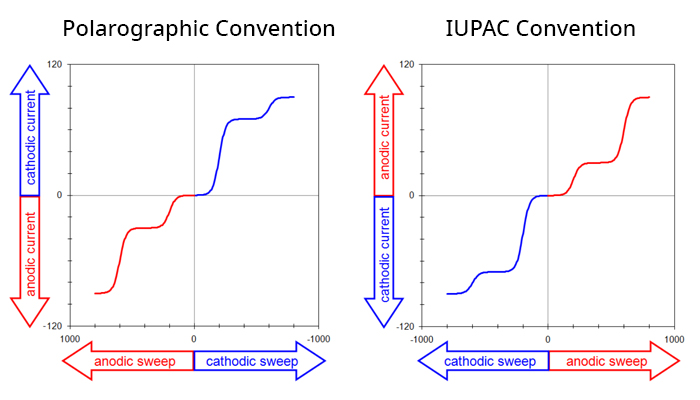
This means there are four possible conventions for plotting a voltammogram, and one should always take a moment to ascertain the orientation of the axes before interpreting a voltammogram. Fortunately, of the four possible ways to plot a voltammogram, only two are commonly used. The older tradition (based on classical polarography) plots cathodic current upwards along the vertical axis and negative (cathodic, reducing) potentials toward the right along the horizontal axis. A complex voltammogram involving four different limiting currents (Figure 1. Left) illustrates this convention, which is sometimes called the North American, Polarographic, or Classic convention.

Figure 1. Polarographic vs IUPAC voltammetry plotting conventions
The same data may be plotted using the IUPAC convention (Figure 1. Right). This convention plots anodic currents upward along the vertical axis and more positive (anodic, oxidizing) potentials to the right along the horizontal axis. The IUPAC convention is more readily understood by those outside the electroanalytical research community (because positive values are plotted to the right along the horizontal axis).
The IUPAC convention is the default plotting convention used by AfterMath and is the convention used throughout all knowledgebase posts. Note that this choice also implies a mathematical sign convention for the current. Specifically, positive current values are considered anodic, and negative current values are considered cathodic in knowledgebase posts. If you are interested in changing the axes see our video on how to invert the axes.
 [VIDEO] How to Invert the Axis
One might ask why the polarographic and IUPAC conventions exist in the first place? Most other analytical chemistry disciplines such as spectroscopy or microscopy only have slight variation in their plotting conventions. It is rumored that the famous electrochemist Jaroslav Heyrovský was doing early polarography work and all his data was plotted in the 3rd quadrant. When publishing articles, all four quadrants needed to be displayed even though there was only data in the 3rd quadrant. Editors complained about the amount of space his voltammograms took, and recommended that he invert the axes so all the data was in the 1st quadrant. This way only the 1st quadrant needed to be plotted and the other 3 quadrants were omitted. This convention would proliferate as other researchers performing polarography published similar voltammograms. This also explains why the it is referred to as the "Polarographic" convention.


