


AfterMath provides you with several important benefits.
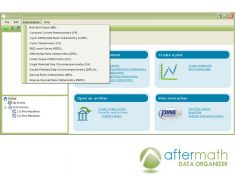
Instrument Control. When started, AfterMath automatically detects all compatible instrumentation attached to your computer and gives you complete control over each instrument. You can connect to one, two, or as many different attached instruments as you wish. You can queue up multiple experiments on one or more instruments, and while they are running, you can simultaneously work with data already acquired in previous experiments.
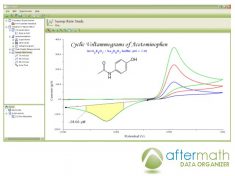
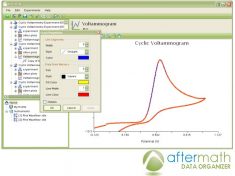
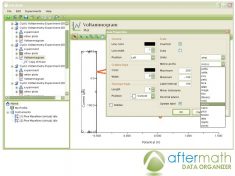
Flexible Plotting. AfterMath has a powerful “drag-n-drop” feature that lets you easily take traces from one plot and simply drag them on to another plot. Making an overlay plot from several voltammograms is a snap. AfterMath gives you precise control over line sizes, point markers, colors, axis limits, axis labels, and tick marks. You can place one or more text boxes anywhere on the plot, and the text may be formatted with any combination of fonts, font sizes, colors that you wish.
Scientific Units. Unlike graphing applications designed for the business and marketing crowd, AfterMath is designed with scientific data in mind. Proper management of scientific units, metric prefixes, scientific notation, and significant figures is built right into the very DNA of Aftermath. If you divide a potential measured in millivolts by a current measured in nanoamps, then Aftermath properly gives you the result as a resistance measured in megaohms.
Tools and Transforms. Flexible tools can be placed on any graph to precisely measure quantities like peak height and peak area. Multiple tools can be placed on a plot, and all such tools remain exactly where you leave them, even if you save and reload your data from disk. Several fundamental mathematical operations (addition, multiplication, integration, logarithm, etc.) can be applied to any trace on any plot.
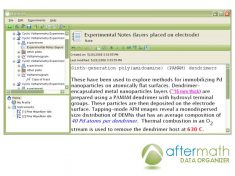
Data Archiving. Our unique and open XML-based file format allows you to keep data from several related experiments together in one single archive file. With AfterMath, you won’t have to go hunting all over your hard drive to find all of your voltammograms. The internal archive hierarchy can contain as many subfolders, reports, plots, notes, experimental parameters, and data sets as you wish.