1. Theory and Application
In addition to the common methods for determining the extent of linearity, causality, and stability during an EIS experiment, investigation into these conditions of validity can be more easily performed on the data after completing the experiment. This is accomplished using the Kramers-Kronig transforms, which are mathematical relations for the real and imaginary components of a complex system that define it as linear, causal, stable, and finite. If any given set of EIS data can be fitted using these expressions, it may generally be assumed that the data is valid impedance.
Strict mathematical application of the Kramers-Kronig transforms is practically impossible for real EIS data because they require integration between limits of zero and infinite frequency, which are not physically possible to measure. A separate technique, developed by Boukamp, is instead typically used, where the experimental data is fitted using a representative circuit (see Figure 1). This circuit itself passes the Kramers-Kronig test; therefore, any real data that can be successfully fitted to it must also pass and therefore be considered valid impedance data.

Figure 1: Representative Circuit Used in Kramers-Kronig Fitting
The Kramers-Kronig representative circuit (see Figure 1) contains an indeterminate number of Voigt elements (resistor-capacitor-in-parallel). The optimal number of these circuit elements varies depending on a few factors, including the number of data points and decades of frequency. It can therefore be tricky for the user to intuitively know the precise number of elements to select. Too few or too many Voigt elements can lead to either an under-constrained or over-constrained condition, which then may produce a false negative result. It is critical that the user know whether a poor Kramers-Kronig fit is the result of improper circuit design or impedance data that truly does not meet the conditions of validity. For this reason, AfterMath software automatically performs an algorithm on every Kramers-Kronig fit, without requiring user input, to determine the optimal number of circuit elements so that the result may be trusted.
An example EIS validity test using Kramers-Kronig analysis in AfterMath is shown below (see Figure 2) for EIS data collected using a dummy cell circuit. The upper pair of plots (Bode and Nyquist) show excellent correlation between experimental results (individual point markers) and the Kramers-Kronig fit (solid lines), with a 
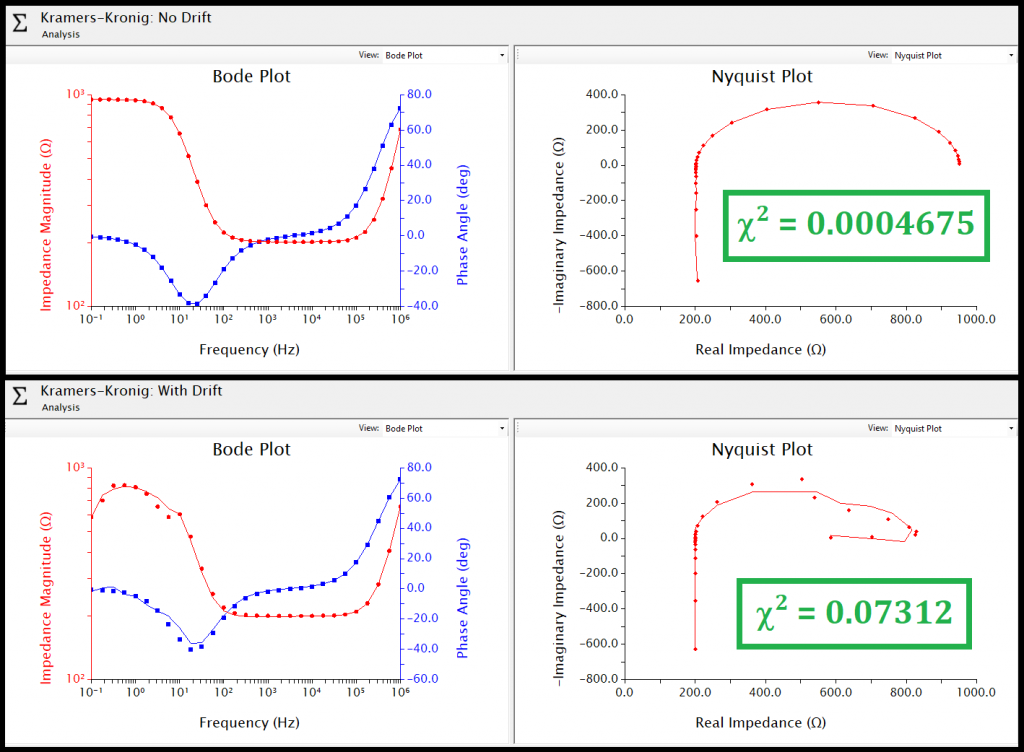
Figure 2: Kramers-Kronig Analysis without drift in EIS
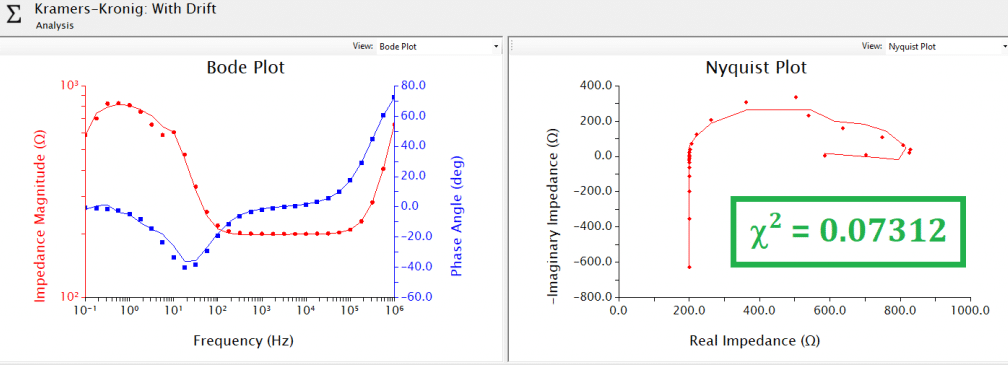
Figure 3: Effect of Drift on EIS Data and Kramers-Kronig Analysis
