This article is part of the AfterMath Data Organizer Electrochemistry Guide[/call_to_action]
[alert icon=”info-circle” color=”blue”] Double potential step chronoamperometry is a technique where the potential of the working electrode is stepped forward for a specified period of time, then stepped back for a specified period of time. Current is monitored and plotted as a function of time.[/alert]
Like most of the other electrochemical techniques offered by the AfterMath software, this experiment begins with an induction period. During the induction period, a set of initial conditions is applied to the electrochemical cell and the cell is allowed to equilibrate to these conditions. The default initial condition involves holding the working electrode potential at the Initial Potential for a brief period of time (i.e., 3 seconds).
After the induction period, the potential of the working electrode is stepped to a specified potential for a period of time.
After the first step has finished, the potential of the working electrode is stepped back for a specified period of time, usually to the potential prior to the forward step. The experiment concludes with a relaxation period. The default condition during the relaxation period involves holding the working electrode potential at the initial potential for an additional brief period of time (i.e., 1 seconds).
At the end of the relaxation period, the post experiment idle conditions are applied to the cell and the instrument returns to the idle state.
Current is plotted as a function of time, resulting in a chronoamperogram. You may also choose to do some post experiment processing in order to generate Cottrell plots.
The parameters for this method are arranged on various tabs on the setup panel. The most commonly used parameters are on the Basic tab which is similar to that for CA with the addition of a Reverse step period box. Additional tabs for Ranges and Post Experiment Conditions are common to all of the electrochemical techniques supported by the AfterMath software. Finally, a Post Experiment Processing tab deals with manipulating the data automatically when the experiment is finished.
You can click on the “I Feel Lucky” button (located at the top of the setup) to fill in all the parameters with typical default values (see Figure 1). You will no doubt need to change the Potential and Hold time in the Forward step period and Reverse step period boxes to values which are appropriate for the electrochemical system being studied. You may also want to change the Number of intervals in the Sampling Control box.
Figure 1: Basic Setup for Double Potential Step Chronoamperometry.
The Electrode K1 Current Range on the Basic tab is used to specify the expected range of current. If the choice of electrode range is too small, actual current may go off scale and be truncated. If the electrode range is too large, the chronoamperogram may have a noisy, choppy, or quantized appearance.
Some Pine potentiostats (such as the WaveNow and WaveNano portable USB potentiostats) have current autoranging capability. To take advantage of this feature, set the electrode range parameter to “Auto”. This allows the potentiostat to choose the current range “on-the-fly” while the chonoamperogram is being acquired.
The waveform that is applied to the electrode is a simple pulse to the Potential listed in the Forward step period box for the Hold time followed by a step back to the Potential specified in the Reverse step period box. Note that the actual waveform that is measured (see Figure 2, red trace) fluctuates slightly compared to the applied potential (see Figure 2, black trace).
Figure 2: Waveform for DPSCA. Black = applied potential, Red trace = measured potential.
AfterMath has the ability to automatically select the appropriate ranges for voltage and current during an experiment. However, you can also choose to enter the voltage and current ranges for an experiment. Please see the separate discussions on autoranging and the Ranges Tab for more information.
After the Relaxation Period, the Post Experiment Conditions are applied to the cell. Typically, the cell is disconnected but you may also specify the conditions applied to the cell. Please see the separate discussion on post experiment conditions for more information.
The Post Experiment Processing Tab (see Figure 3) looks similar to that for CA and allows you to automatically generate Cottrell current, Cottrell charge, DPSCA working curve, or DPSCC working curve plots. Please see the Typical Results and Theory sections of this wiki for more information regarding Cottrell plots and DPSCA/DPSCC working curves.
Figure 3: Post Experiment Processing Options.
The results for a solution of Ferrocene in
are shown in Figure 4. Specific conditions include the use of a
Pt WE, forward step potential of
and reverse step potential of
.
Figure 4: Double Potential Step Chronoamperogram of a Ferrocene Solution
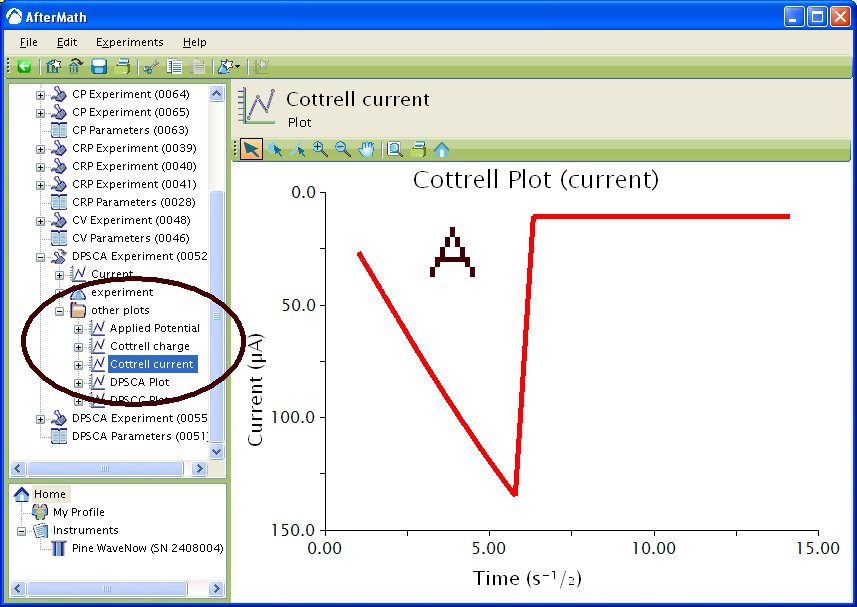
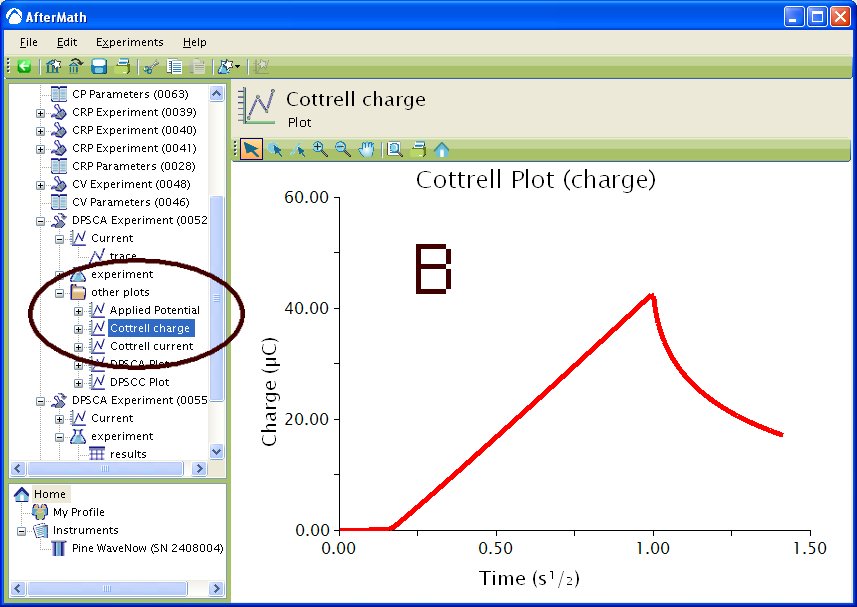
If you selected to automatically generate Cottrell plots, the plots are under the other plots folder in the Archive navigation panel. Choosing Cottrell current displays a plot of current versus the (see Figure 5A). Choosing Cottrell charge displays a plot of charge versus
(see Figure 5B). Note that for the Cottrell Current plot, the level portion in the plot is actually the time prior to the current spike shown in Figure 4. That is, earlier time points are to the right in a Cottrell Current Plot. This is not the case for a Cottrell Charge plot because integrating the current with respect to time gives charge.


Figure 5 : Post experiment processing plots. A – Cottrell Current, B – Cottrell Charge. Conditions as listed in Figure 4.
If you selected to automatically generate DPSCA or DPSCC working curves, they are also under the other plots folder in the Archive navigation panel. The theory for the forward step in DPSCA is the same as the theory for the first step in CA, however the theory for the reverse step is complicated by the first step. The DPSCA working curve (see Figure 6) is a useful way to examine if kinetic complications of the redox species are present. If there are no kinetic complications and both potential steps are to regions of diffusion-limited currents, the actual (see Figure 6, red trace) working curve will overlay the ideal (see Figure 6, black trace) working curve. The ideal working curve is theoretically generated according to the equation
where is the reverse current at
,
is the forward current at
and
. A quick check for a stable system is:
Figure 6: DPSCA Working Curve. Actual = red trace, Ideal = black trace. Conditions as listed in Figure 4.
The DPSCC working curve (see Figure 7) is a useful way to examine the charge passed during an experiment and is similar to the Cottrell Charge plot except that it separates the forward (see Figure 7, red trace) and reverse (see Figure 7, black trace) steps. The reverse step is corrected to account for the charge passed during the forward step, making the charge passed in the reverse step linear with respect to time.
Figure 7 : DPSCC Working Curve. Forward – red trace, Reverse – black trace. Conditions as listed in Figure 4.
As stated in the Theory section of CA, the time-dependent current transient in a diffusion-limited chronoamperometry experiment is governed by the Cottrell2 equation
where is the number of electrons,
is Faraday's Constant (
),
is the electrode area (
),
is the diffusion coefficient (
), and
is the concentration (
). In DPSCA, the time of the transition must be taken into account. The current transient for the second pulse, provided it produces diffusion-limited currents, is governed by the equation first obtained by Kambara3
where is the transition time and the other parameters are as above. Dividing the reverse current at time
by
and keeping
allows for the generation of a working curve given by the equation
If there are no kinetic complications in the electrode reaction, the actually working curve should fall on an ideal working curve as shown in Figure 6. Note that the deviation at the beginning of the working curve is due to the electronics of the potentiostat.
DPSCA is a technique that is often used to elucidate mechanisms related to coupled homogeneous reactions preceeding or following an electrode reaction. Bard and Faulkner1 give a more detailed description of using DPSCA to elucidate mechanisms. A brief description will be given here as to what types of mechanisms can be elucidated and how you might apply DPSCA. Several examples are listed in the Application section also.
The simplest coupled homogeneous reactions are Electrochemical-Chemical (EC) and Chemical-Electrochemical (CE).
This example uses DPSCA to calculate the diffusion coefficients for a subtrate () and a product (
) of an electrode reaction. Hyk et al.4 examined the current transients for DPSCA to analyze the reaction
. The researchers generated equations for dealing with both hemispherical electrodes and disk microelectrodes under diffusion-limited and mixed diffusion-migration. Interestingly, the researchers were able to show that for an uncharged substrate with less than
supporting electrolyte they are able to obtain diffusion coefficients. This is significant because an uncharged substrate with less than 0.1% supporting electrolyte does not lend to calculation of diffusion coefficients by single potential step chronoamperometry.
In this next example, Long et al.5 used a slight variant of DPSCA to examine diffusion and self-exchange in a cobalt bipyridine redox polyether hybrid. Films of material, containing supporting electrolyte, were prepared on inter-digitated array electrodes (IDAs). A pulse was generated (equivalent to a double-potential step) on one set of fingers on the IDA while the current was monitored on the second set of fingers on the IDA. Monitoring the time it takes for the pulse to travel from the generator set of fingers to the collector set of fingers allowed for the calculation of diffusion coefficients and self-exchange rate constants between metal centers.
In the final example, Schwarz and Shain6 used DPSCA to measure the rate constant for a chemical reaction after an electrochemical reaction, commonly referred to as an EC reaction. The overall reaction for the general process is
where the product is electrochemically inactive. In this example, the researchers reduce azobenzene to hydrazobenzene which in turn rearranges to benzidine in acidic solutions. By varying the time of the second step, the researchers were able to determine the rate constant for the reaction of hydrazobenzene rearrangning to benzidine.
1. Faulkner, L. R.; Bard, A. J. Basic Potential Step Methods, Electrochemical Methods: Fundamentals and Applications, 2nd ed.; Wiley: New Jersey, 2000; 156-225.
2. Cottrell, F. G. Z. Physik, Chem., 42, 1902, 385.
3. Kambara, T. Bull. Chem. Soc. Jpn., 1954, 27, 523.
4. Hyk, W; Nowicka, A.; Stojek, Z. Anal. Chem., 2002, 74, pp 149–157.
5. Long, J. W.; Terrill, R. H.; Williams, M. E.; Murray, R. W. Anal. Chem., 1997, 69, pp 5082–5086.
6. Schwarz, W. M.; Shain, I. J. Phys. Chem., 1965, 69, pp 30-40.
Links: Electrochemist's Guide, AfterMath User's Guide, AfterMath Main Support Page
Related Techniques: Chronoamperometry (CA)
End User Certification of Exported Goods
All orders from Pine Research Instrumentation that are destined to be exported for use outside of the United States requires that the parties involved (end-user, intermediate consignee, and ultimate consignee) disclose the parties involved in the transaction. By signing this form, parties acknowledge having read and understood export restrictions and requirements.
"*" indicates required fields


