This article is part of the AfterMath Data Organizer User’s Guide
[/call_to_action]

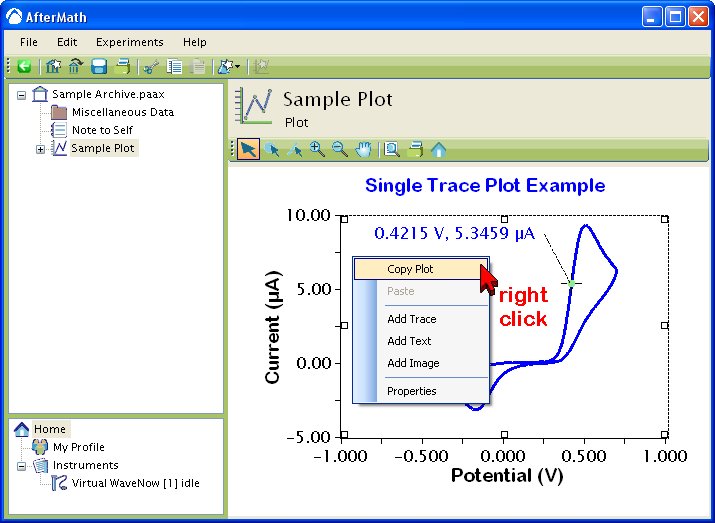
A very simple plot residing in an archive is shown in the figure below. The plot has a title, axes, gridlines, and one single data trace on it. The plot could be made more complex by adding additional traces, adding one or more measurement tools, adding text boxes, or by adding additional axes (top axis and/or right axis) to the plot.
As is the case with most other items in an archive, a plot may be moved, copied, or duplicated almost anywhere in the archive. You can also copy plots from one archive to another archive.
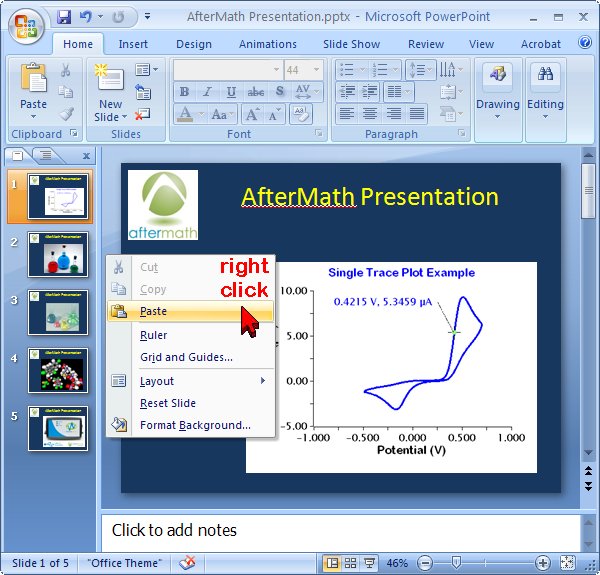
If you right-click on a plot and choose “Copy Plot” from the popup menu, then a bitmap image of the plot is placed on the system clipboard. This bitmap image may subsequently be pasted from the system clipboard into other applications, including many word processing documents, spreadsheets, and presentation files.
An example of copying a plot to a Microsoft Powerpoint presentation is detailed in two steps:


