This article is part of the AfterMath Data Organizer User’s Guide
[/call_to_action]

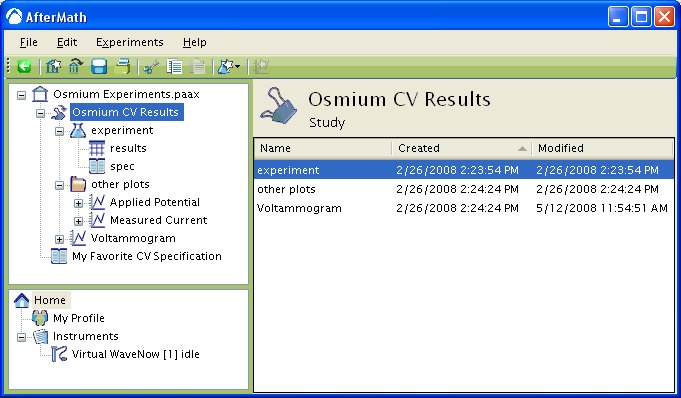
 When an experiment concludes, AfterMath places all of the results generated by the experiment into a special folder called a study folder. The study folder has a special icon which looks like a large paper clip. Inside a study folder you will find a read-only copy of the experiment results and specification along with one or more plots of the results. The precise contents of a study folder will vary depending upon the type of experiment you are performing.
The date and time that the experiment was performed can be deduced from the creation date of the items found in the study folder. Usually there is one main plot in the folder which is representative of the experimental results. In the example above, this main plot is called “Voltammogram”. Then, if there are any other plots related to the experiment, they are placed in the “Other Plots” folder.
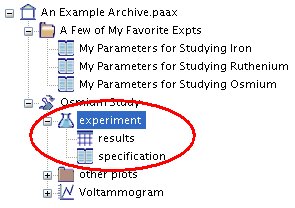
 The raw data and the experiment specification are bound together underneath an icon which looks like a flask. The raw data is stored in a data table (named “results”) containing the measurements made during the experiment. The experiment specification (named “specification”) is a read-only copy of the parameters used to perform the experiment.
Unlike most other items found in an archive, AfterMath will not permit you to delete, move, or otherwise separate the experiment data from the experiment specification. The specification is “frozen” in a read-only state so that you do not accidently change the record of how the experiment was performed. However, AfterMath will permit you to make an “editable” copy of the experiment specification and store it somewhere else in the archive. Simply click on the “Create Copy” button at the top of the specification, and an “editable” copy will be created.

