This article is part of the AfterMath Data Organizer User’s Guide[/call_to_action]
There are a variety of ways to put a trace on a plot, and you should take the time to learn about all of them. Here is a list of some of the ways to do this:
-
Use the “Add Trace” Menu Option (discussed in this article)
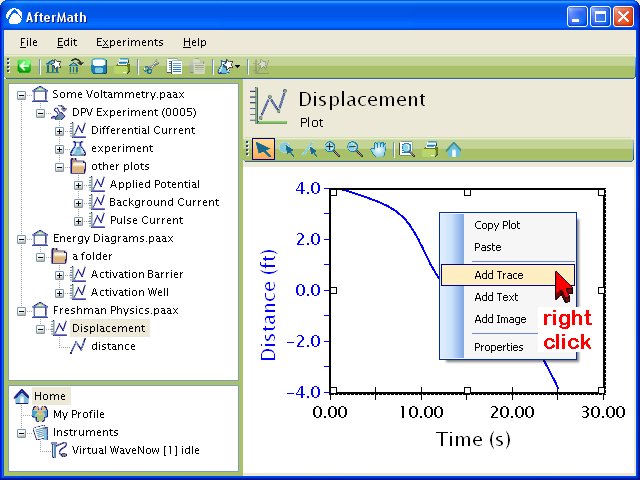
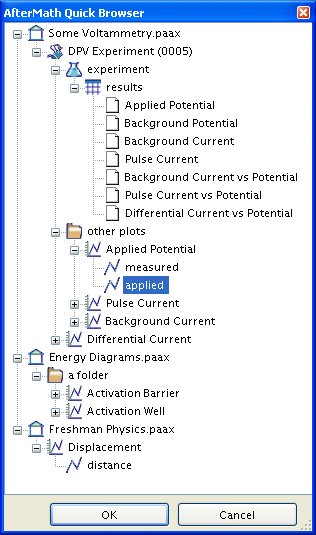
One way to add a new trace to an existing plot is to right-click on the plot area an choose “Add Trace” from the popup menu. This causes the AfterMath “Quick Browser” to appear. The Quick Browser lists all possible data sources for the new trace from all presently open archives. Choose the data source of interest and click on the “OK” button. This process is illustrated in the example below.
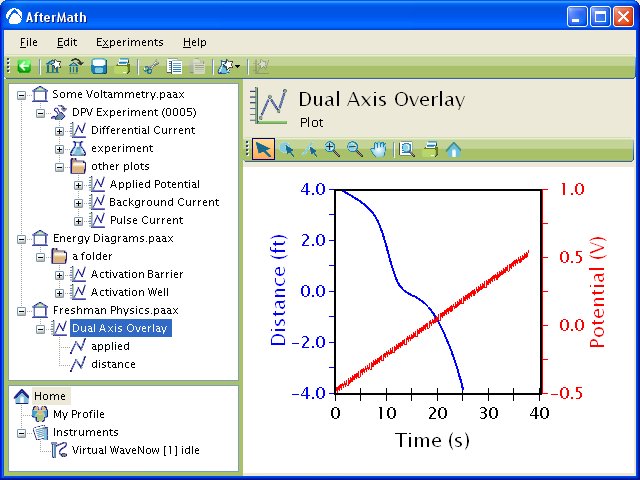
In the example provided, the original plot had one trace showing a distance versus time relationship. But, the trace added to the plot was a voltage versus time relationship. AfterMath recognized that a second vertical axis was needed, and automatically added the voltage axis on the right side of the plot. In the resulting overlay plot, the original trace is plotted against the left axis (distance), and the added trace is plotted against the right axis (voltage). Both traces were able to share the same horizontal axis because both traces are plotted against time, so there was no need to create a second horizontal axis.
Sometimes when you try to add a trace to a plot, there is no room to add an new axis against which to plot the trace. In this case, AfterMath will add the trace to the plot, and you will be able to see it in the archive tree. However, the trace will not actually be drawn on the plot because an appropriate axis is not available. If you delete one of the other conflicting traces from the plot, then the added trace may be drawn.
In the example above, the Quick Browser shows all possible data sources from all open archives. There are three open archives containing a variety of plots and data tables. The Quick Browser allows you to select any of the available signals from a data table or any of the traces from an existing plot.


