This FAQ applies to versions 1.0.2447 and greater.[/call_to_action]
Follow the steps below to use the Dummy Cell to perform cyclic voltammetry.
Make sure your potentiostat is connected to the computer system and is turned on.
[/accordion_item] [accordion_item title = “Step 2”]
Login to the AfterMath software (which you should have previously installed on your computer).
Installation instructions may be found at the link below:
Click Here
Physically connect the potentiostat to your electrochemical cell using an appropriate cell cable. Note that some Pine potentiostats come with a “Dummy Cell” as shown below that may be used for quick verification of the instrument and software.
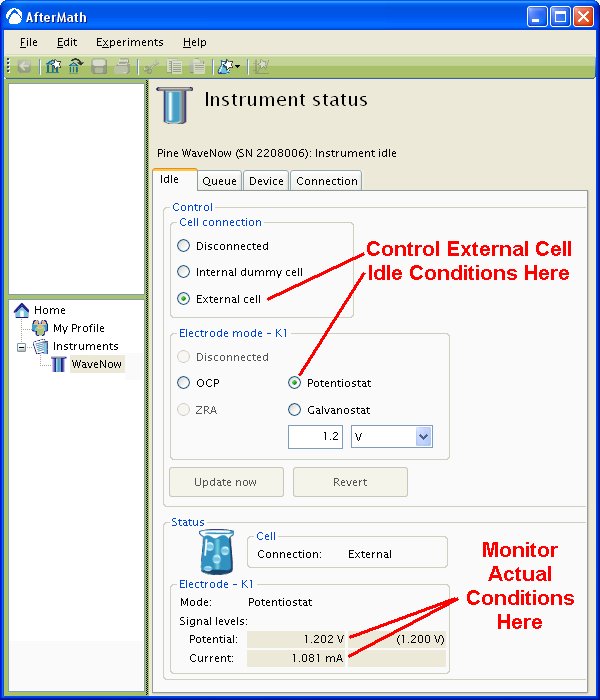
[/accordion_item] [accordion_item title = “Step 4”] Examine the Instrument Status (see below). Initially, the status should indicate that the cell is a “disconnected” state. If desired, you may use the controls to apply a known idle condition to the cell. In the example below, the instrument has been adjusted to idle in the potentiostat mode while applying to the working electrode.
From the AfterMath home page, select the “Cyclic Voltammetry” option from the experiment list (see below). (Alternately, you may choose “Cyclic Voltammetry” from the “Experiment” menu.) A new cyclic voltammetry experiment specification is created and placed in a new archive.
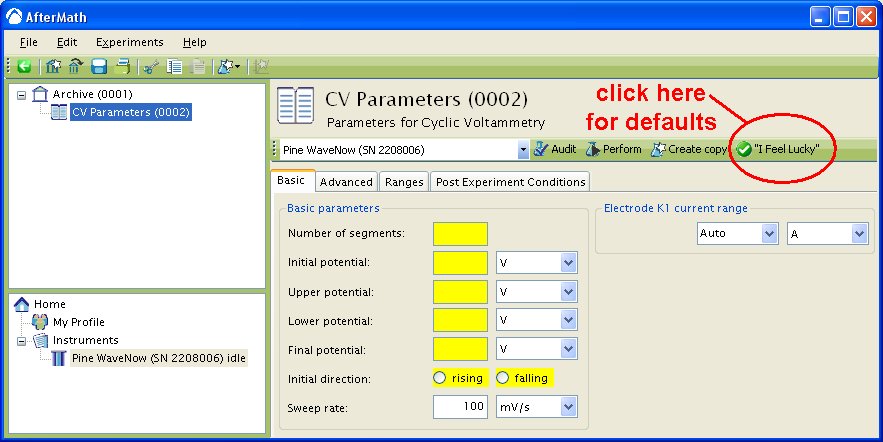
[/accordion_item] [accordion_item title = “Step 6”]Enter the required parameters describing the cyclic voltammetry experiment into the boxes which are shaded yellow. To use a set of default parameters, click on the “I Feel Lucky” button.
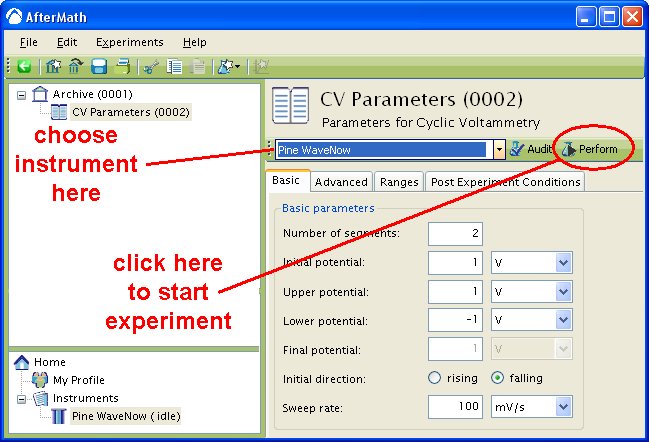
[/accordion_item] [accordion_item title = “Step 7”]Choose your potentiostat in the drop-down menu (to the left of the “Audit” button). Then, press the “Perform” button to start the experiment.
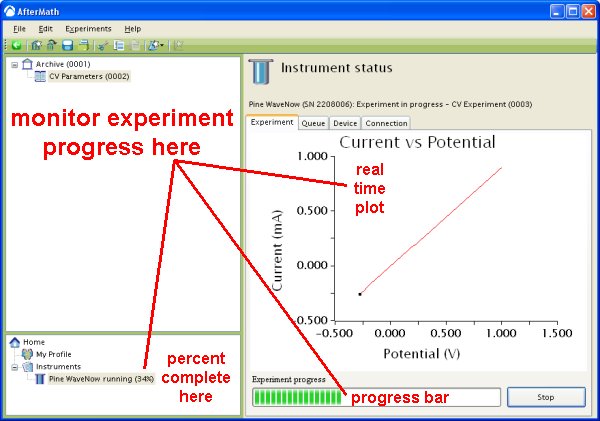
[/accordion_item] [accordion_item title = “Step 8”]Monitor the progress of the experiment on the real time plot or the progress bar.
[/accordion_item] [accordion_item title = “Step 9”]The results of the experiment are placed in a study folder in the archive. In addition to the main plot of the voltammogram, additional graphs are created in the “Other Plots” folder. The results are also available in tabular form.
NOTE: The diagonal line in the plot above is clearly not an actual voltammogram. This pure ohmic response reflects the summed value of two series resistors on “Dummy Cell C” as follows: The charge transfer resistor () is nominally
, and the uncompensated resistor (
) is
. Thus, the slope of the diagnonal line reflects a combined nominal resistance of
. (The precise value of the summed resistance can be deduced from the inverse slope of the diagonal line. In this case the
value is
.)


