


EIS Accuracy Contour Plot
Last Updated: 9/20/21 by daniel
1Accuracy Contour Plot
The ability of an Electrochemical Impedance Spectroscopy (EIS) instrument to make an accurate impedance measurement varies with both the frequency of interest and the actual load being measured. An Accuracy Contour Plot (ACP) provides a visual tool for understanding the EIS measurement accuracy limits for a particular instrument. The ACP maps out the range of available excitation frequencies along the horizontal axis and the range of measurable loads along the vertical axis (see Figure 1).
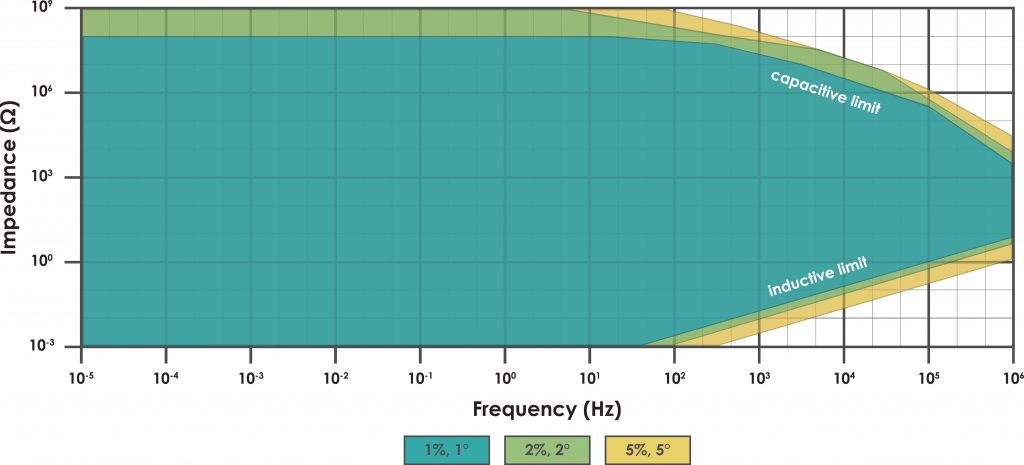
Figure 1. Sample EIS Accuracy Contour Plot
Various regions of the ACP plot are marked (usually by shading with different colors) with each region representing a different level of accuracy. For any given excitation frequency and load, the corresponding point can be located on the ACP, and the particular region in which the point falls indicates the expected accuracy of the EIS measurement.
The example ACP in Figure 1 shows three regions of accuracy. The large, inner, conically-shaped region (which is shaded blue) indicates the wide range of frequencies and loads where the potentiostat can accurately measure the complex impedance magnitude to within one percent (± 1.0%) and the complex impedance phase angle to within one degree (± 1.0°).
Two smaller and thinner regions on the ACP (one shaded green and the other shaded yellow) show where an EIS measurement becomes less accurate. The green region shows where the potentiostat can measure the impedance magnitude to within two percent (± 2.0%) and the phase angle to within two degrees (± 2.0°). The yellow region shows where the impedance magnitude can be measured to within five percent (± 5.0%) and the phase angle to within five degrees (± 5.0°).
When working at high frequencies with large loads, the measurement accuracy is limited by the influence of stray capacitance in the system. (The system includes the electrochemical cell, the electrodes, the cable connections to the electrodes, and the measurement circuitry within the instrument itself.) This capacitive limit is readily observable on the ACP (see the upper-right part of Figure 1) where regions of lower accuracy appear as diagonal bands sloping downwards going towards higher frequencies.
When working with high frequencies and small loads, the measurement accuracy is limited not by stray capacitance, but rather by stray inductance in the system. The inductive limit is also readily observable on the ACP (see the lower-right part of Figure 1) where regions of lower accuracy appear as diagonal bands sloping upwards going towards higher frequencies.
The example ACP above is based upon EIS measurements made under ideal conditions (i.e., Faraday cage connected to instrument chassis, proper orientation of cell cables, floating DC Common, standard length cell cable) using known loads (precision resistors and capacitors) to probe the accuracy of measurements near the capacitive and inductive limits. The majority of the ACP (loads greater than 100 mΩ) is based upon potentiostatic EIS measurements (10 mVRMS). The lower portion of the ACP (loads less than or equal to 100 mΩ) is based upon galvanostatic EIS measurements (100 mARMS).
There are many factors that may affect the accuracy of an EIS measurement, such as the grounding/shielding configuration, the cell cable arrangement, and the choice of EIS experimental parameters (amplitude, filters, etc.). Particular care and attention to detail is required when making (and interpreting) EIS measurements at frequencies above 100 kHz.