This article is part of the AfterMath Data Organizer User’s Guide
Creating a Plot from a Data Table
The easiest way to create a plot is directly from some data in a data table. When you are viewing a data table, there is a button near the top of the table labeled “Create Plot”. If you click on this button, then a new plot is created which has one trace on it. The trace shows one of the signal relationships from the data table. This information is discussed in more detail in another section of this manual (see Section 3.2 Data Tables).
Creating an Empty Plot
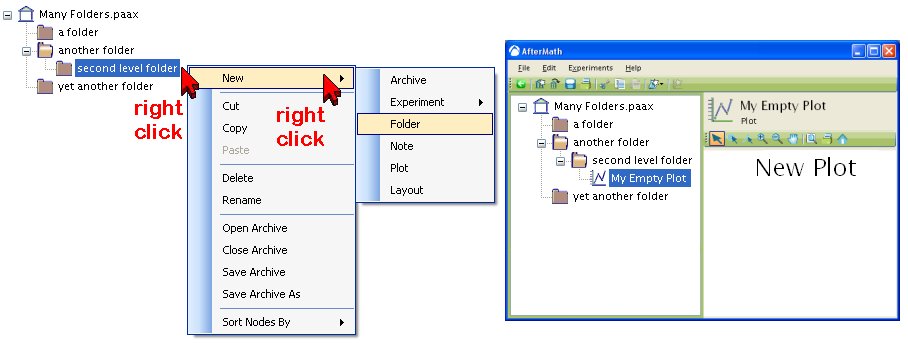
You may create a new and empty plot in an archive by right-clicking at the desired location within the archive and choosing “New » Plot” from the popup menu.
An empty plot isn't very interesting. You can add traces to an empty plot in one of the following ways:


Comments: