The actual waveform that is applied to the electrode is linear but not truly analog (see Figure 3A). The flat portions at the beginning and end of the waveform are the induction and relaxation periods, respectively. A typical two segment sweep starts at an initial potential, sweeps to a vertex potential, and then returns to a final potential. The sweep is not perfect; in reality is consists of many small steps (see Figure 3B, black trace, sweep rate  ) which are generated using the maximum available resolution of the potentiostat's digital-to-analog converter (DAC).
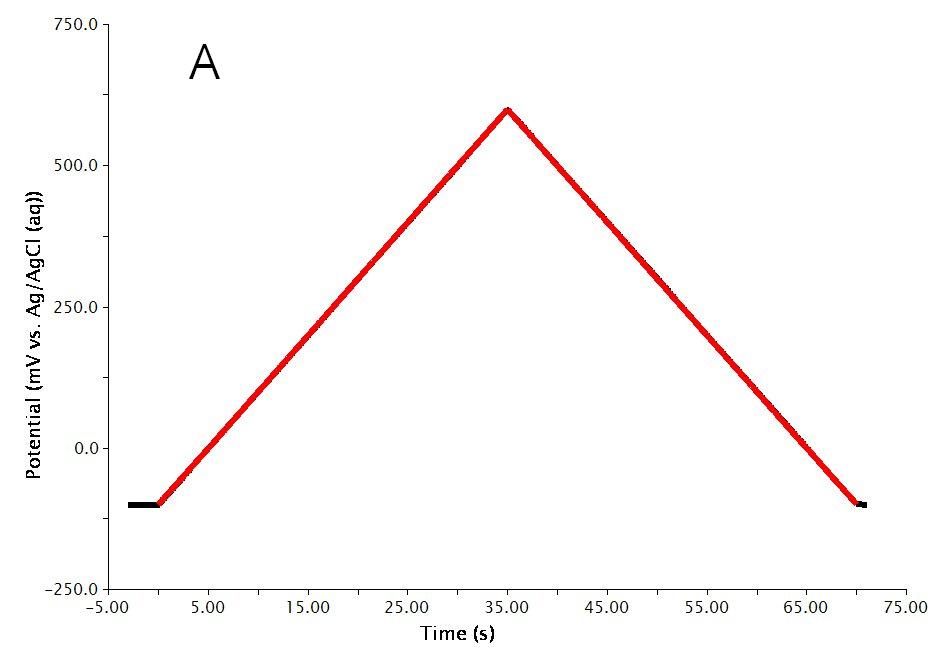
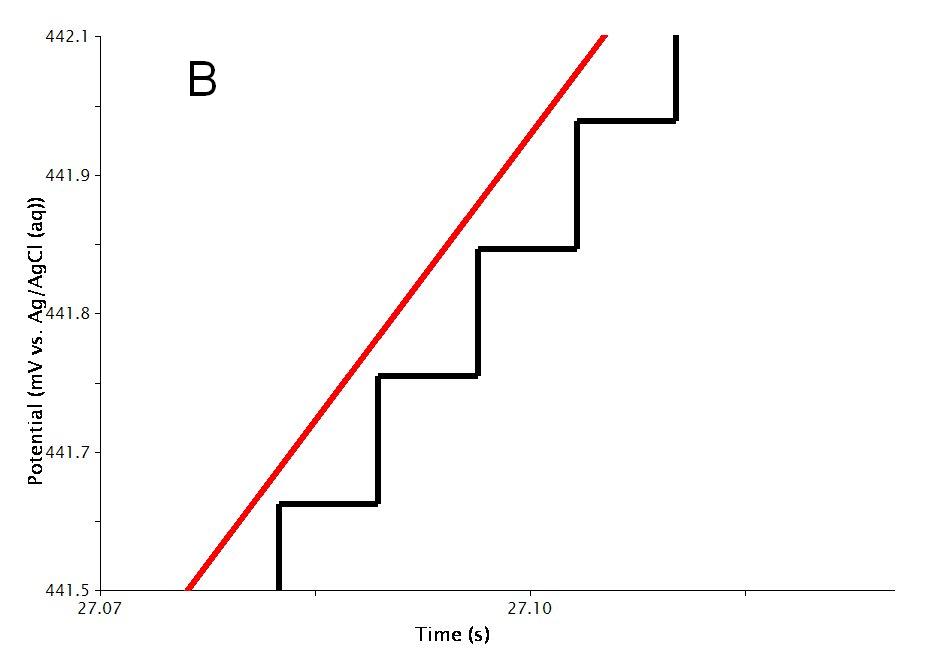
Figure 3: Two Segment RDE Waveform Details of A) the Total Waveform and B) a Magnified Waveform showing the Stepped, Applied Potential (black) and Measured Potential (red)
While RDE typically consists of one or two segments it is possible to choose any number of segments. If you choose any odd number of segments greater than two (see Figure 4), the parameters that must be entered are a little different than the two segment case. You must choose an Initial Potential, Upper Potential, Lower Potential, and Final potential. You must also choose whether the Initial direction is rising (sweep towards Upper Potential) or falling (sweep towards Lower Potential). If the Initial direction is rising, the Final potential must be different than the Lower potential. If the Initial direction is falling, the Final potential must be different than the Upper potential.
Figure 4: Basic tab setup for three segment RDE
If you choose any even number of segments greater than two (see Figure 5) the parameters that must be entered are the same as the three segment case. You must choose an Initial Potential, Upper Potential, Lower Potential, and Final potential. You must also choose whether the first sweep is initially rising (sweep towards Upper Potential) or falling (sweep towards Lower Potential). If the Initial direction is rising, the Final potential must be different than the Upper potential. If the Initial direction is falling, the Final potential must be different than the Lower potential.
Figure 5: Basic tab setup for four segment RDE
Advanced Tab
The Advanced Tab for this method (see Figure 6) allows you to change the behavior of the potentiostat during the induction period and relaxation period. By default, the potential applied to the working electrode during the induction and relaxation period will match the initial potential and final potential, respectively, as specified on the Basic Tab. You may override this default behavior, and you may also change the durations of the induction and relaxation periods if you wish.
Other important parameters on the Advanced tab are found in the Sampling Control area. This area contains two parameters, Alpha and Threshold which control when and how samples are acquired during the sweep portion of the experiment.
Figure 6: Advanced parameters for RDE
As mentioned previously, the waveform applied to the electrode (see Figure 3) is not truly linear. The actual waveform is a staircase of small potential steps. The duration of each small step is called the step period, and the step period is automatically chosen to take full advantage of the resolution of the potentiostat's digital-to-analog converter.
The Alpha parameter controls the exact time within the step period at which the current is sampled. A alpha value of zero means the current is sampled at the start of the step period, immediately after a new potential step is applied. An alpha value of 100 means the current is sampled at the end of the step period, immediately before the next potential step is applied.
Changing alpha will have little effect on the voltammogram for a freely diffusing species in solution; however, variations in alpha can dramatically influence the results for surface bound species, especially when using older potentiostats with low DAC resolution (i.e., 12-bit).
Newer potentiostats (such as the WaveNow and WaveNano portable USB potentiostats) have 16-bit DAC resolution, so voltammograms acquired using these instruments are less influenced by the choice of alpha value. Nevertheless, researchers who use digital potentiostats to study surface-confined electrochemical systems (rather than freely diffusing species in solution) should be aware of the influence of this parameter. Further details can be found in the literature1 and in a related article about CBP Bipotentiostat Interface Boards.
The Threshold parameter helps you to limit the amount of data retained as the voltammogram is acquired. The threshold parameter controls the interval between samples as the potential is swept from one limit to another. By default, a data point is acquired every time the sweep moves 5 millivolts. You can change the threshold from 5 millivolts to a smaller interval (if you want to acquire more data) or to a greater interval (if you want to acquire less data).
Extreme values for the threshold parameter can lead to undesirable results (see Figure 7 of cyclic voltammetry). A very small Threshold value will produce smooth curves yet results in large files. A very large value though, results in jagged curves.
Range Tab
AfterMath has the ability to automatically select the appropriate ranges for voltage and current during an experiment. However, you can also choose to enter the voltage and current ranges for an experiment. Please see the separate discussions on autoranging and the Ranges Tab for more information.
Post Experiment Conditions Tab
After the Relaxation Period, the Post Experiment Conditions are applied to the cell. Typically, the cell is disconnected but you may also specify the conditions applied to the cell. Please see the separate discussion on post experiment conditions for more information.
Typical Results
The typical results for a one electrode reversible redox process is a sigmoidal shaped voltammogram (see Figure 7, specific parameters were:  Ferrocene in Ferrocene in  , ,  Pt disk, Pt disk,  , ,  ). ).
Figure 7: Rotating Disk Voltammogram of a Ferrocene Solution
The limiting current can be obtained from the voltammogram by right clicking on the trace and selecting “Add Tool » Peak Height” (see Figure 8, specific parameters were:  Ferrocene in Ferrocene in  , ,  Pt disk, Pt disk,  , ,  ). The peak height that is initially drawn (see Figure 9, specific parameters were identical to Figure 8) may have to be changed to properly measure the limiting current. ). The peak height that is initially drawn (see Figure 9, specific parameters were identical to Figure 8) may have to be changed to properly measure the limiting current.
Figure 8: Addition of Peak Height Tool to Measure Limiting Current
Figure 9: Peak Height Tool Added
By dragging the control points on the tool around you can draw a proper baseline (see Figure 10).
Figure 10: A Proper Baseline for Measurement of the Limiting Current
The baseline type that is initially chosen typically does a good job for a one component reversible system such as that shown above. However, you can change the baseline type by right clicking on the tool and selecting “Properties” (see Figure 11).
Figure 11: Selection of Baseline Properties
This will bring up a dialog box where you can select the type of baseline from the drop-down menu (see Figure 12).
Figure 12: Dialog Box Showing Baseline Types
A series of rotation speeds was used to examine the  Ferrocene solution mentioned above (see Figure 13). The limiting current for a freely diffusing species in solution is proportional to the square root of the rotation speed (see Figure 13, inset). Ferrocene solution mentioned above (see Figure 13). The limiting current for a freely diffusing species in solution is proportional to the square root of the rotation speed (see Figure 13, inset).
Figure 13: Effect of varying the rotation speed for a Ferrocene Solution from 300 – 2500 rpm. Inset: Plot of Limiting Current versus Square Root of Rotation Speed.
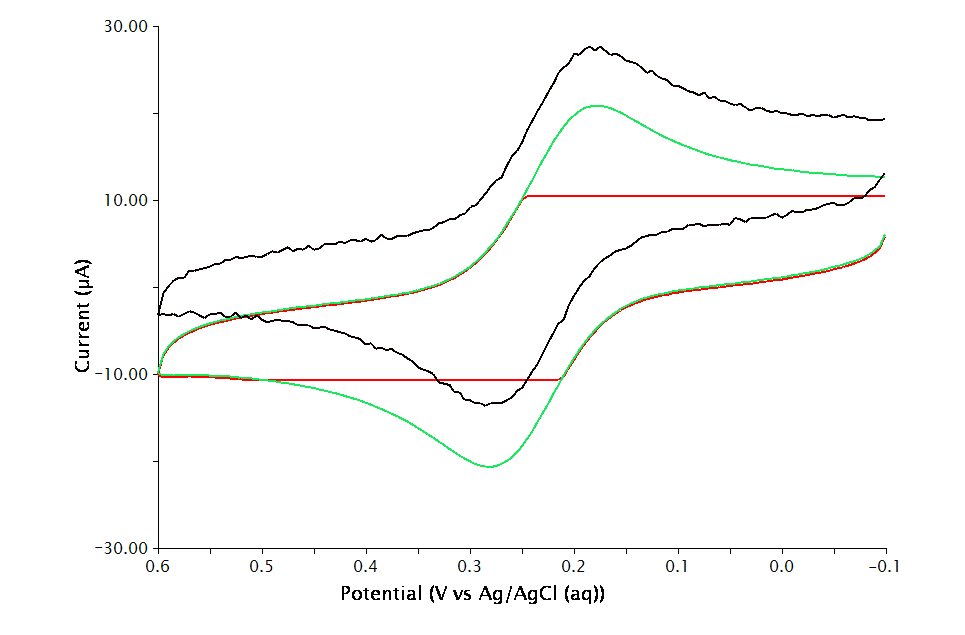
Typical sweep rates are  . As long as the system being studied remains in steady-state conditions, sweep rate will have no effect on the limting current. When sweep rates get fast, voltammograms obtained begin to look like typical cyclic voltammograms where the electrode is not rotated. This is due to depletion of the Levich layer of the species being oxidized or reduced. As an example, there is no difference between . As long as the system being studied remains in steady-state conditions, sweep rate will have no effect on the limting current. When sweep rates get fast, voltammograms obtained begin to look like typical cyclic voltammograms where the electrode is not rotated. This is due to depletion of the Levich layer of the species being oxidized or reduced. As an example, there is no difference between  and and  sweep rates for a sweep rates for a  Ferrocene solution when the rotator speed is Ferrocene solution when the rotator speed is  (see Figure 14, Black trace = (see Figure 14, Black trace =  (underneath Red trace), Red trace = (underneath Red trace), Red trace =  , Blue trace = , Blue trace =  , Green trace = , Green trace =  ). However, when the sweep rate is ). However, when the sweep rate is  or or  , the voltammograms show signs of depletion of the Levich layer and begin to resemble voltammograms seen in traditional CV. Please see the Theory section for more details if necessary. , the voltammograms show signs of depletion of the Levich layer and begin to resemble voltammograms seen in traditional CV. Please see the Theory section for more details if necessary.
Figure 14: Effect of varying the Sweep Rate for a Ferrocene Solution.
Theory
The following theoretical introduction to RDE is intended to give the reader a general understanding so that they may better understand what parameters affect the outcome in a typical experiment. A more detailed description can be found in Bard and Faulkner.2 Rotating the electrode is a method of forced convection with the purpose of continually delivering material to the electrode in a controlled manner. The rotating rod creates a vortex flow underneath the electrode which pulls material upwards.
The purpose of rotating the electrode is to keep the solution homogeneous. However, next to the electrode is a stagnant layer, called the Levich layer which actually “clings” to the electrode and rotates with it. Inside this layer, the primary mode of mass transport is diffusion. Even though the primary mode of mass transport is diffusion like in cyclic voltammetry, linear sweep voltammetry, or chronoamperometry the concentration gradient at the electrode remains constant with respect to time. Since the concentration gradient remains constant with respect to time, the current is a steady-state current.
The thickness of the Levich layer will depend upon the experimental conditions and is governed by the equation

where  is the diffusion coefficient (in is the diffusion coefficient (in  ), ),  is the rotation speed ( is the rotation speed ( ), and ), and  is the kinematic viscosity (in is the kinematic viscosity (in  , see Table 1). , see Table 1).
Table 1: Kinematic Viscosities for  Solutions at Solutions at  1 1 |
| Solution |
 |
 |
 |
 |
 |
 (acetonitrile) (acetonitrile) |
 |
 (dimethylsulfoxide) (dimethylsulfoxide) |
 |
| Pyridine |
 |
 (dimethylformamide) (dimethylformamide) |
 |
| N,N-Dimethylacetamide |
 |
 (hexamethylphosphoramide) (hexamethylphosphoramide) |
 |
 |
 |
The limiting current at electrode is proportional to the thickness of the Levich layer and is defined by

where  is the number of electrons in the electrochemical reaction, is the number of electrons in the electrochemical reaction,  is Faraday's constant ( is Faraday's constant ( ), ),  is the electrode area (in is the electrode area (in  ), and ), and  is the concentration (in is the concentration (in  ). Finally, the fully expanded limiting current is defined by the Levich equation, ). Finally, the fully expanded limiting current is defined by the Levich equation,
 . .
Application
In the first example, Gallaway and Barton3 coated an electrode with an oxygen-reducing enzyme and a series of redox-polymers. The purpose of this was to examine mediated electron transfer in a biocatalyzed fuel cell. Varying the type of redox-polymer used, the researchers were able to examine rate constants as a function of overpotential between the enzyme and mediator. These data were then used to determine the optimum polymer redox potential in order to get maximum power output for a hypothetical biofuel cell.
The next example uses RDE to examine the reduction of ferricyanide, in the prescence of methylene blue (MB), at a DNA-modified electrode. Boon et al.4 used a gold-disk electrode that was modified with self-assembled monolayers of a double-stranded oligonucleotide selective for the adsorption of MB. The rate limiting step was determined, from RDE, to be the adsorption of MB onto the electrode. Despite slow sweep rates, the resulting voltammograms showed interesting “peak-shaped” i-V traces that took several seconds to reach their steady-state values. These “peak-shaped” traces were attributed to the slow transfer of MB into and out of the film.
The third example, Orilall et al.5 synthesized Pt and Pt-Pb nanoparticles and incorporated them into mesoporous niobium-oxide/carbon composites. Heat treating this composite made a graphitic-like material that was assembled onto a glassy carbon disk electrode. The researchers investigated this material for formic acid oxidation and found that it had a four times higher mass activity and lower onset potential than any previously reported Pt-Pb nanoparticles.
In the fourth example, Zhang et al.6 used RDE to examine the reduction of oxygen. Multiwalled carbon nanotubes (MWCNTs) were functionalized with a Co-porphyrin complex and then mixed with Nafion. This material was then dropcast onto a glassy carbon disk electrode. RDE was then used to show that the mechanism for oxygen reduction was a direct four-proton and four-electron reduction of oxygen to water. These results showed that the materials would be a suitable substitute for platinum or other metal-based cathode materials in proton conducting membrane fuel cells.
The fifth example uses RDE to examine the mechanism of electrochemical reduction of H2O2 on Cu in acidic sulfate solutions. Stewart and Gerwith7 studied the interaction of H2O2 with Cu because H2O2 is commonly used as an oxidizer component in chemical mechanical planarization (CMP) slurries. CMP is used in microelectronics applications. By using RDE, the researchers were able formulate a mechanism that involved a never observed before Cu(I) intermediate following peroxide exposure. The researchers went on to use other techniques to look for and find this Cu(I) intermediate.
The final example shows how RDE can be used in a teaching lab for advanced undergraduate or first-year graduate chemistry or chemical engineering labs. Kear et al.8,9 use Cu disk electrodes in aerated sea water to examine the reduction of oxygen at a cathode surface. This is a way to introduce electrochemical engineering and corrosion to students and is informative in explaining cathodic kinetics in corrosion reactions. The students also used this experiment as a hand-on approach to learning about mass transfer since the examination of the limiting current at various rotation speeds allows for the calculation of the diffusion coefficient for oxygen.
References
1. He, P. Anal. Chem., 1995, 67, 986-992.
2. Faulkner, L. R.; Bard, A. J. Methods Involving Forced Convection – Hydrodynamic Methods, Electrochemical Methods: Fundamentals and Applications, 2nd ed.; Wiley: New Jersey, 2000; 331-367.
3. Gallaway, J. W.; Barton, S. A. C. J. Am. Chem. Soc., 2008, 130, 8527–8536.
4. Boon, E. M.; Barton, J. K.; Bhagat, V.; Nersissian, M.; Wang, W.; Hill, M. G. Langmuir, 2003, 19, 9255–9259.
5. Orilall, M. C.; Matsumoto, F.; Zhou, Q.; Sai, H.; Abruna, H. D.; DiSalvo F. J.; Wiesner, U. J. Am. Chem. Soc., 2009, 131, 9389–9395.
6. Zhang, W.; Shaikh, A. U.; Tsui, E. Y.; Swager, T. M. Chem. Mater., 2009, 21, 3234–3241.
7. Stewart, K. L.; Gewirth, A. A. Langmuir, 2007, 23, 9911–9918.
8. Chemical Engineering Education
9. Kear, G.; A. P.-de-L., C.; Walsh, F. C. Chem. Eng. Ed., 2005, 39, 14-21.
Posted 1/4/2016
in Uncategorized
Read More
| to the working electrode.
) is nominally
, and the uncompensated resistor (
) is
. Thus, the slope of the diagnonal line reflects a combined nominal resistance of
. (The precise value of the summed resistance can be deduced from the inverse slope of the diagonal line. In this case the
value is
.)
) used in an experiment. Therefore, all experiment results are with respect to whatever electrode was actually used. That is, there is no automatic offsetting to adjust results to match any standard reference electrode (e.g.
).
filled with saturated
is
. Therefore the offset is
s ( in other words, voltage measured using the
was
greater than it would have been if an
had been used ).


