This article is part of the AfterMath Data Organizer Electrochemistry Guide
Detailed Description
Like most of the other electrochemical techniques offered by the AfterMath software, this experiment begins with an induction period. During the induction period, a set of initial conditions is applied to the electrochemical cell and the cell is allowed to equilibrate to these conditions. The default initial condition involves holding the working electrode current at the Initial Current for a brief period of time (i.e., 3 seconds).
After the induction period, the current of the working electrode is swept linearly at the specified Sweep Rate to the Final Current.
After the sweep has finished, the experiment concludes with a relaxation period. The default condition during the relaxation period involves holding the working electrode current at the final current for an additional brief period of time (i.e., 1 seconds).
At the end of the relaxation period, the post experiment idle conditions are applied to the cell and the instrument returns to the idle state.
The working electrode potential is plotted as a function of the current applied to the working electrode, resulting in a potentiogram.
Parameters Setup
The parameters for this method are arranged on various tabs on the setup panel. The most commonly used parameters are on the Basic tab, and less commonly used parameters are on the Advanced tab. Additional tabs for Ranges tab and Post Experiment Idle Conditions tab are common to all of the electrochemical techniques supported by the AfterMath software.
Basic Tab
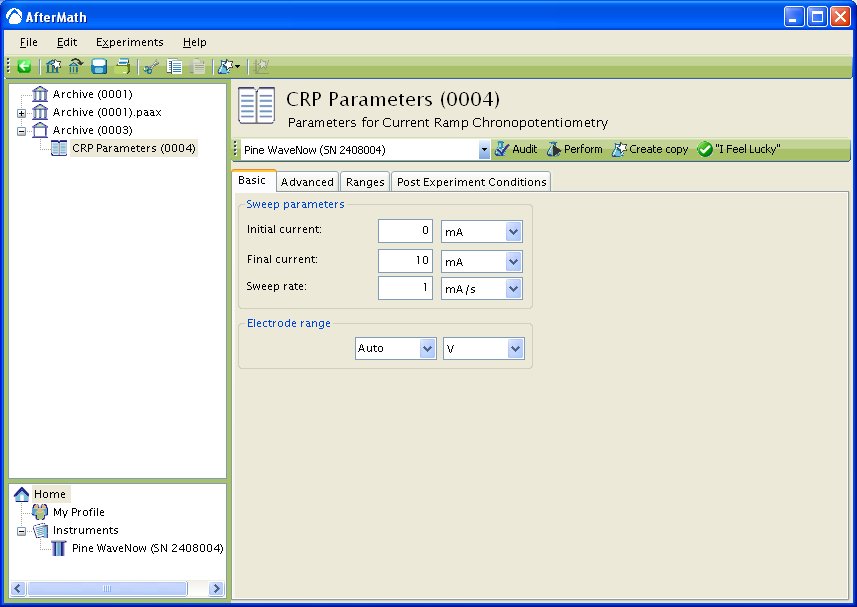
You can click on the “I Feel Lucky” button (located at the top of the setup) to fill in all the parameters with typical default values. You will no doubt need to change the Initial Current, Final Current, and Sweep Rate to values which are appropriate for the electrochemical system being studied.
Figure 1 : CRP Basic Parameters Setup
The Electrode Range on the Basic tab is used to specify the expected range of potentials. The potential of the electrode is dictated according to the Nernst equation, assuming a fully reversible system (see Theory section below), and will change to the value necessary to maintain the specified current. Therefore, if the choice of potential range is too small, actual potential may go off scale and the results will be truncated. If the potential range is too large, the potentiogram may have a noisy, choppy, or quantized appearance. Please see the ugly duckling webpage for an analogous situation in a voltammogram.
The actual waveform that is applied to the electrode is linear but not truly analog (see Figure 2A). The flat portions at the beginning and end of the waveform are the induction and relaxation periods, respectively. A typical sweep starts at an initial current and sweeps to the final current. The sweep is not perfect; in reality is consists of many small steps (see Figure 2B, orange trace, sweep rate = ) which are generated using the maximum available resolution of the potentiostat’s digital-to-analog converter (DAC).
Figure 2: CRP Waveform Details Showing A) the Total Waveform and B) a Magnified Waveform Showing the Applied Current (Orange) and Measured Current (Red).
Advanced Tab
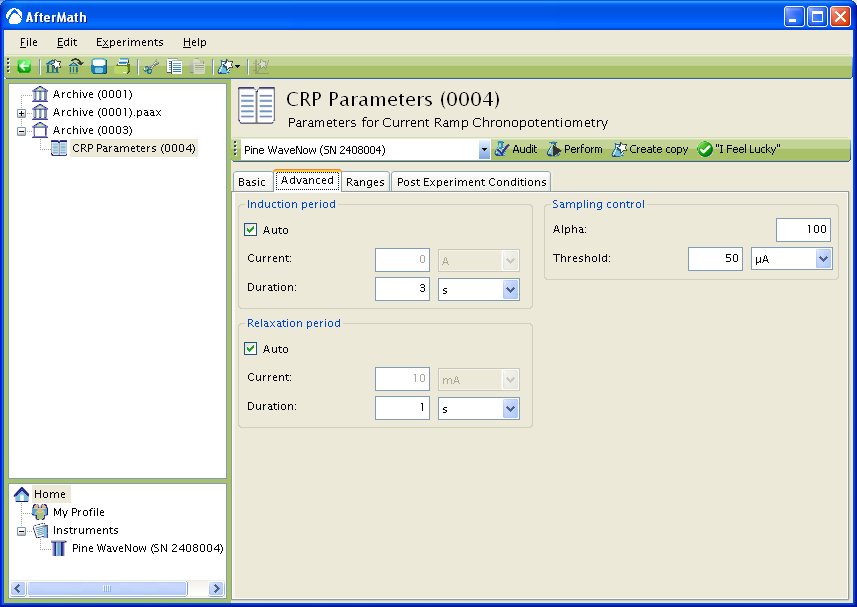
The Advanced Tab for this method (see Figure 3) allows you to change the behavior of the potentiostat during the induction period and relaxation period. By default, the current applied to the working electrode during the induction and relaxation period will match the initial current and final current, respectively, as specified on the Basic Tab. You may override this default behavior, and you may also change the durations of the induction and relaxation periods if you wish.
Other important parameters on the Advanced tab are found in the Sampling Control area. This area contains two parameters, Alpha and Threshold which control when and how samples are acquired during the sweep portion of the experiment.
Figure 3: Advanced parameters setup for Current Ramp Chronopotentiometry
As mentioned previously, the waveform applied to the electrode (see Figure 2) is not truly linear. The actual waveform is a staircase of small current steps. The duration of each small step is called the step period, and the step period is automatically chosen to take full advantage of the resolution of the potentiostat’s digital-to-analog converter.
The Alpha parameter controls the exact time within the step period at which the potential is sampled. A alpha value of zero means the potential is sampled at the start of the step period, immediately after a new current step is applied. An alpha value of 100 means the potential is sampled at the end of the step period, immediately before the next current step is applied. (See also the analogous discussion of the Alpha parameter in the description of cyclic voltammetry for more information.)
The Threshold parameter helps you to limit the amount of data retained as the potentiogram is acquired. The threshold parameter controls the interval between samples as the current is swept from one limit to another. As shown in the example in Figure 3, a data point is acquired every time the sweep moves 50 microamps. You could change the threshold from 50 microamps to a smaller interval (if you want to acquire more data) or to a greater interval (if you want to acquire less data).
It is very likely that you will need to change the Threshold parameter in order to obtain the best possible data from your particular electrochemical system. Extreme values for the threshold parameter can lead to undesirable results. A smaller threshold value, typically less than or equal to 5 microamps, produces smoother curves and larger data files. If you set the threshold parameter to zero, then the maximum number of data points is acquired (and the size of the resulting data file will be quite large). If you set the parameter to a very large interval, then the number of points acquired will be so small that the potentiogram appears sharp and jagged. (See also the analogous discussion of the Threshold parameter in the description of cyclic voltammetry for more information.)
Ranges Tab
AfterMath has the ability to automatically select the appropriate ranges for current and voltage during an experiment. However, you can also choose to enter the current and voltage ranges for an experiment. Please see the separate discussions on autoranging and the Ranges Tab for more information.
Post Experiment Conditions Tab
After the Relaxation Period, the Post Experiment Conditions are applied to the cell. Typically, the cell is disconnected but you may also specify the conditions applied to the cell. Please see the separate discussion on post experiment conditions for more information.
Typical Results
Typical results for a solution of ferrocene are shown in Figure 4. Potential can be plotted against time (see Figure 4A) or against current (see Figure 4B, specific parameters were: Ferrocene in
,
OD Pt WE,
sweep rate).
Figure 4 : A) Potential vs. Time and B) Potential vs. Current Chronopotentiograms for a Ferrocene Solution
Theory
The following is a very brief introduction to the theory of current ramp chronopotentiometry. Consult sources such as Bard and Faulker2 or Murray and Reilley3,4 for more detailed information.
CRP is a technique that, like CV, can be utilized to calculate a concentration or a diffusion coefficient. Consider a reaction with a formal potential
. As a current is applied to the working electrode,
begins getting reduced at the electrode surface, producing
. The potential of the electrode, E, moves to values characteristic of the
couple, based on a time-based Nernstian relation. As the concentration of
drops to zero at the electrode surface the potential starts to rapidly increase to more negative values. The resulting
curve is much like a potentiometric titration with a transition time (analogous to an equivalence point),
. The potential at one half
is
. The transition time is related to the concentration and diffusion coefficient of
through the expression
where is the concentration of
(
),
is the number of electrons,
is Faraday’s Constant (
),
is the electrode area (
),
is the diffusion coefficient (
) and
is the sweep rate (
).
For rapid electrode kinetics, the time-based Nernstian equation is
where is equal to
Finally, plotting should give a straight line with slope of
for a reversibile
curve.
References
1. He, P. Anal. Chem., 1995, 67, 986-992.
2. Faulkner, L. R.; Bard, A. J. Controlled-Current Techniques, Electrochemical Methods: Fundamentals and Applications, 2nd ed.; Wiley: New Jersey, 2000; 305-330.
3. Murray, R. W.; Reilley, C. N. J. Electroanal. Chem., 1962, 3, 64-77.
4. Murray, R. W.; Reilley, C. N. J. Electroanal. Chem., 1962, 3, 182-202.


Comments: