This article is part of the AfterMath Data Organizer Electrochemistry Guide
Detailed Description
Like most of the other electrochemical techniques offered by the AfterMath software, this experiment begins with an induction period. During the induction period, a set of initial conditions is applied to the electrochemical cell and the cell is allowed to equilibrate to these conditions. The default initial condition involves holding the working electrode potential at the Initial Potential for a brief period of time (i.e., 3 seconds). Since the potentiostat is being used to control the rotator speed, the rotator is also spun at the desired Initial speed during this time.
At each rotation speed, the potential of the rotating disk is cycled according to the parameters the you entered. After the sweep has finished at the final rotation speed, the experiment concludes with a relaxation period. The default condition during the relaxation period involves holding the working electrode potential at the final potential for an additional brief period of time (i.e., 1 seconds).
At the end of the relaxation period, the post experiment idle conditions are applied to the cell and the instrument returns to the idle state.
Current is plotted as a function of the potential applied to the rotating disk for each rotation speed, resulting in a series of voltammograms.
Parameter Setup
The parameters for this method are arranged on various tabs on the setup panel. The most commonly used parameters are on the Basic tab, and less commonly used parameters are on the Advanced tab. Additional tabs for Ranges and Post Experiment Conditions are common to all of the electrochemical techniques supported by the AfterMath software.
Basic Tab
You can click on the “I Feel Lucky” button (located at the top of the setup) to fill in all the parameters with typical default values. You will no doubt need to change the Initial Potential, Final Potential, and Sweep Rate to values which are appropriate for the electrochemical system being studied.
The Basic tab contains the same parameters as RDE except that the Rotator Parameters box contains an Initial speed, a Final speed, an Increment method, and an Iterations (see Figure 1). The rotation speeds will be chosen based on the Increment method and the number of Iterations. The different Increment methods are Linear, Levich, Koutecky, Eisenberg and Custom (see Figure 2). When Linear is chosen the rotation speeds will be evenly spaced between the Initial speed and Final speed. When Levich is chosen, the increments will be spaced such that the increases in the limiting current () are constant with respect to
(
. When Koutecky is chosen, the increments will be spaced such that the inverse of the increases in the limiting current are constant with respect to
. When Eisenberg is chosen, the increments will be spaced such that the increase in limiting current is proportional to
(
). Finally, when Custom is chosen, you as the user enter the values of each rotation speed between the Initial speed and the Final speed.
KL-RDE is typically done in order to obtain a heterogeneous rate constant for the species of interest. Therefore, typically you choose one segment and enter an Initial potential, Final potential, Sweep rate, and Rotator Speed. Please see the webpage regarding RDE if more than one segment is needed.
Figure 1: Basic Setup Tab with Linear Increment Method Chosen.
Figure 2: Basic Setup Tab Showing Different Increment Methods.
The Electrode Range on the Basic tab is used to specify the expected range of current. If the choice of electrode range is too small, actual current may go off scale and be truncated. If the electrode range is too large, the voltammogram may have a noisy, choppy, or quantized appearance. Please see the ugly duckling webpage for more information.
Advanced Tab
The Advanced Tab for this method (see Figure 3) is the same as the Advanced Tab for RDE and allows you to change the behavior of the potentiostat during the induction period and relaxation period. By default, the potential applied to the working electrode during the induction and relaxation period will match the initial potential and final potential, respectively, as specified on the Basic Tab. You may override this default behavior, and you may also change the durations of the induction and relaxation periods if you wish.
Other important parameters on the Advanced tab are found in the Sampling Control area. This area contains two parameters, Alpha and Threshold which control when and how samples are acquired during the sweep portion of the experiment.
Figure 3: Advanced Parameters for KL-RDE
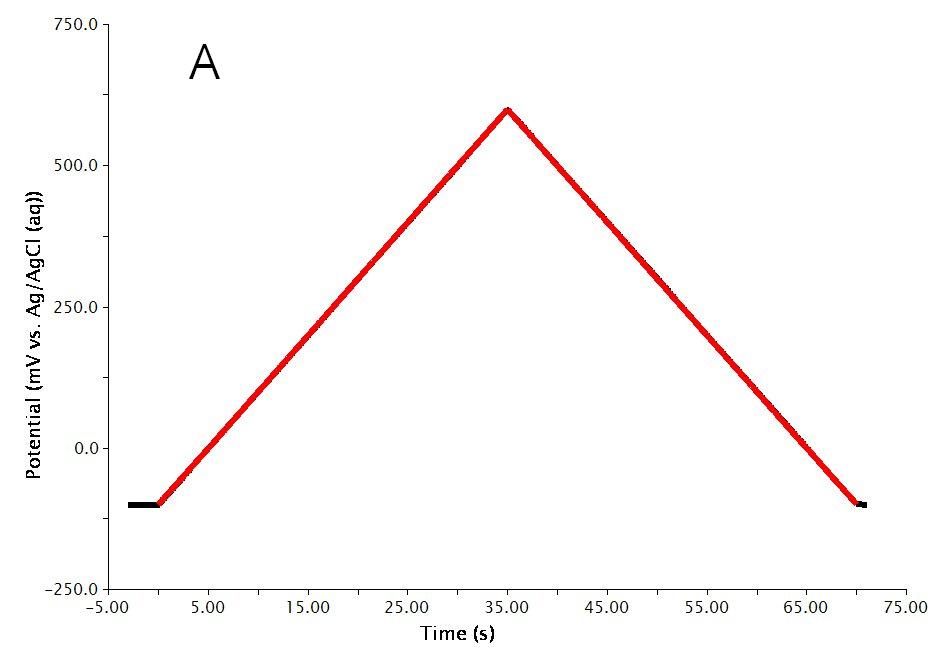
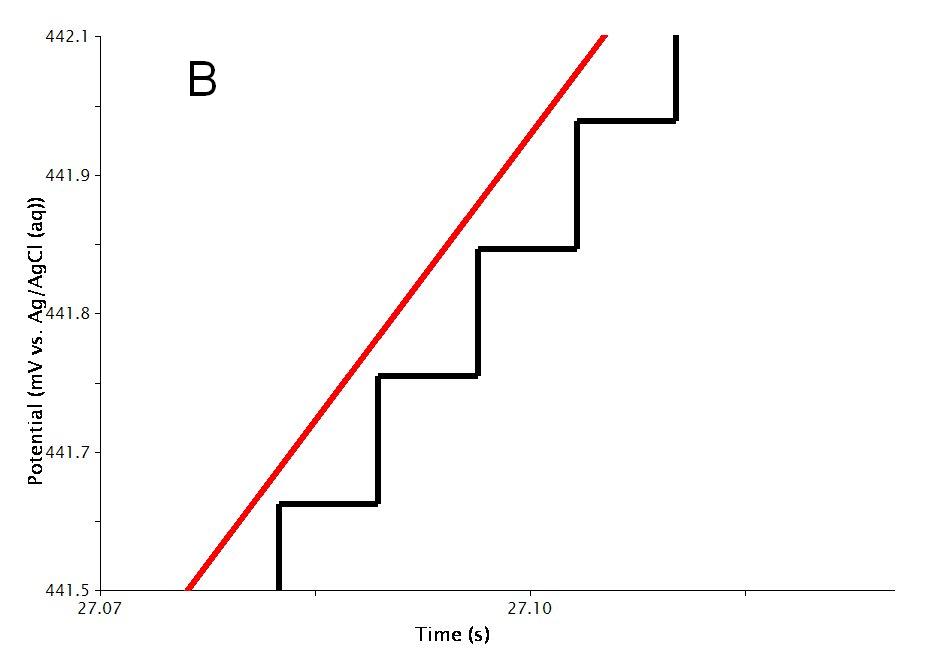
As mentioned previously, the waveform applied to the electrode (see Figure 4A for a two-segment example) is not truly linear. The actual waveform is a staircase of small potential steps (see Figure 4B). The duration of each small step is called the step period, and the step period is automatically chosen to take full advantage of the resolution of the potentiostat's digital-to-analog converter.


Figure 4: Two Segment RDE Waveform Detailing the A) Total waveform and B) Magnified Waveform Showing the Applied Potential Steps (black trace) and Measured Potential (red trace)
The Alpha parameter controls the exact time within the step period at which the current is sampled. A alpha value of zero means the current is sampled at the start of the step period, immediately after a new potential step is applied. An alpha value of 100 means the current is sampled at the end of the step period, immediately before the next potential step is applied.
Changing alpha will have little effect on the voltammogram for a freely diffusing species in solution; however, variations in alpha can dramatically influence the results for surface bound species, especially when using older potentiostats with low DAC resolution (i.e., 12-bit).
Newer potentiostats (such as the WaveNow and WaveNano portable USB potentiostats) have 16-bit DAC resolution, so voltammograms acquired using these instruments are less influenced by the choice of alpha value. Nevertheless, researchers who use digital potentiostats to study surface-confined electrochemical systems (rather than freely diffusing species in solution) should be aware of the influence of this parameter. Further details can be found in the literature1 and in a related article about CBP Bipotentiostat Interface Boards.
The Threshold parameter helps you to limit the amount of data retained as the voltammogram is acquired. The threshold parameter controls the interval between samples as the potential is swept from one limit to another. By default, a data point is acquired every time the sweep moves 5 millivolts. You can change the threshold from 5 millivolts to a smaller interval (if you want to acquire more data) or to a greater interval (if you want to acquire less data).
Extreme values for the threshold parameter can lead to undesirable results (see Figure 7 of cyclic voltammetry). A very small Threshold value will produce smooth curves yet results in large files. A very large value though, results in jagged curves.
Ranges Tab
AfterMath has the ability to automatically select the appropriate ranges for voltage and current during an experiment. However, you can also choose to enter the voltage and current ranges for an experiment. Please see the separate discussions on autoranging and the Ranges Tab for more information.
Post Experiment Conditions Tab
After the Relaxation Period, the Post Experiment Conditions are applied to the cell. Typically, the cell is disconnected but you may also specify the conditions applied to the cell. Please see the separate discussion on post experiment conditions for more information.
Typical Results
Consider a Ferrocene solution in
. The typical results obtained from KL-RDE are a series of sigmoid shaped voltammograms (see Figure 5, specific parameters were: rotation speeds
,
increments,
sweep rate,
Pt disk).
Figure 5: KL-RDE Results for a Ferrocene Solution
You can add a peak height tool to each of the voltammograms in order to obtain limiting currents (ilim) at each rotation speed. The example below, taken from the RDE webpage, illustrates how to determine . Right click on the trace and select “Add Tool » Peak Height” (see Figure 6). The peak height that is initially drawn (see Figure 7) may have to be changed to properly measure
. Note, specific parameters for figures 6 and 7 were:
Ferrocene in
,
Pt disk,
, and
sweep rate.
Figure 6 Adding the Peak Height Tool to Measure Limiting Current
Figure 7: Addition of Peak Height Tool to Measure Limiting Current
By dragging the control points on the tool around you can draw a proper baseline (see Figure 8).
Figure 8: A Proper Baseline for Measurement of the Limiting Current
The baseline type that is initially chosen typically does a good job for a one component reversible system such as that shown above. However, you can change the baseline type by right clicking on the tool and selecting “Properties” (see Figure 9).
Figure 9: Selection of Baseline Properties
This will bring up a dialog box where you can select the type of baseline from the drop-down menu (see Figure 10).
Figure 10: Dialog Box Showing Baseline Types
After all the limiting currents have been determined (see Figure 11) you can plot versus
(
is the rotation speed in
), to check that the species of interest is freely diffusing in solution (see Figure 12). The result should be a straight line.
Figure 11: Results with Peak Heights for a Ferrocene Solution
Figure 12: versus
As determined by the equation shown below, plotting versus
will give a plot (see Figure 13) whose y-intercept is the inverse of the limiting current as determined by the heterogeneous rate constant (
).
where is the number of electrons for the reaction,
is Faraday's Constant (
),
is the electrode area (in
),
is the diffusion coefficient of the species of interest (in
),
is the kinematic viscosity (in
) and
is the concentration (in
).
Figure 13: Koutecky-Levich plot.
Theory
The theory section is split between what has already been defined for RDE in a prior webpage, and additional information about Koutecky-Levich RDE.
Rotating Disk
The following theoretical introduction to RDE is intended to give the reader a general understanding so that they may better understand what parameters affect the outcome in a typical experiment. A more detailed description can be found in Bard and Faulkner.2 Rotating the electrode is a method of forced convection with the purpose of continually delivering material to the electrode in a controlled manner. The rotating rod creates a vortex flow underneath the electrode which pulls material upwards.
The purpose of rotating the electrode is to keep the solution homogeneous. However, next to the electrode is a stagnant layer, called the Levich layer which actually “clings” to the electrode and rotates with it. Inside this layer, the primary mode of mass transport is diffusion. Even though the primary mode of mass transport is diffusion like in cyclic voltammetry, linear sweep voltammetry, or chronoamperometry the concentration gradient at the electrode remains constant with respect to time. Since the concentration gradient remains constant with respect to time, the current is a steady-state current.
The thickness of the Levich layer will depend upon the experimental conditions and is governed by the equation
where is the diffusion coefficient (in
),
is the rotation speed (
), and
is the kinematic viscosity (in
, see Table 1).
| Table 1: Kinematic Viscosities for |
|
| Solution | |
| |
|
| |
|
| |
|
| |
|
| Pyridine | |
| |
|
| N,N-Dimethylacetamide | |
| |
|
| |
|
The limiting current at electrode is proportional to the thickness of the Levich layer and is defined by
where is the number of electrons in the electrochemical reaction,
is Faraday's constant (
),
is the electrode area (in
), and
is the concentration (in
). Finally, the fully expanded limiting current is defined by the Levich equation,
.
Koutecky-Levich RDE
The limiting current described in the section above is the diffusion limited current for RDE. KL-RDE is used to extract heterogeneous rate constants for the species of interest. This is accomplished by extrapolating what the limiting current would be at infinitely high rotation speeds. Consider the equation below
where is the heterogeneous rate constant limited current, and the other parameters are as described above. Plotting
vs.
will give a line whose y-intercept is
. The heterogeneous rate constant can be calculated using the equation
where is the heterogeneous rate constant (in
) and the other parameters are as above.
Application
In the first example, Rajasekharan et al.3 use KL-RDE to extract heterogeneous rate constants for for the reduction of free chlorine and monochloramine. Studying these two chlorines is significant because they are the most commonly used drinking water disinfectants. The researchers found that the reduction of free chlorine proceeds twice as fast as monochloramine.
The second example Finklestein et al.4 use KL-RDE to investigate the oxidation of at gold and platinum surfaces. The researchers studied these two surfaces due to possible use in a borohydride fuel cell. Conventional wisdom has been that gold will outperform platinum in a
fuel cell, however, by using KL-RDE the researchers were able to show that platinum is a more ideal surface for the oxidation of
due to higher heterogeneous rate constants and also a larger operational window.
The third example uses KL-RDE in a slightly different way. Rather than measuring heterogeneous rate constants, Shigehara et al.5 used KL-RDE to investigate self-exchange rates for and
. Polyelectrolytes were initially deposited on the electrode surface followed by electrostatic self assembly of the redox species of interest. Using KL-RDE allowed the researchers to extract the self-exchange rate constant since the limiting step at infinitely high rotation rates would be the exchange of the electrons between complexes at the film/solution interface.
In the final example, Kundu et al.6 used KL-RDE to investigate the oxygen reduction reaction (ORR) using doped and undoped carbon nanotubes. Rather than extracting a rate constant the researchers used the slope of the Koutecky-Levich plot to obtain the number of electrons transferred during the ORR. Using doped carbon nanotubes, the researchers found that the number of electrons transferred during the reaction was 4, meaning that oxygen is reduced to in a four electron process. Using undoped carbon nanotubes, the researchers found that the number of electrons transferred was 2.5, meaning that most of the oxygen in this case is reduced to
.
References
1. He, P. Anal. Chem., 1995, 67, 986-992.
2. Faulkner, L. R.; Bard, A. J. Potential Sweep Methods, Electrochemical Methods: Fundamentals and Applications, 2nd ed.; Wiley: New Jersey, 2000; 226-260.
4. Finklestein, D. A.; Da Mota, N.; Cohen, J. L.; Abruna, H. D. J. Phys. Chem. C., ASAP
5. Shigehara, K.; Oyama, N.; Anson, F. C. Inorg. Chem., 1981, 20, 518-522.


Comments: