


Plot
Last Updated: 10/7/19 by Neil Spinner
1Plot
An example cyclic voltammogram plot is shown in Figure 1. The plot contains a title, axes, axis labels, and a single data trace. The plot can be made more complex by adding additional traces, measurement tools or transforms, text boxes or images, or by changing the colors/styles of any lines or text. The visual characteristics shown in Figure 1 represent the default settings for a plot generated in AfterMath.
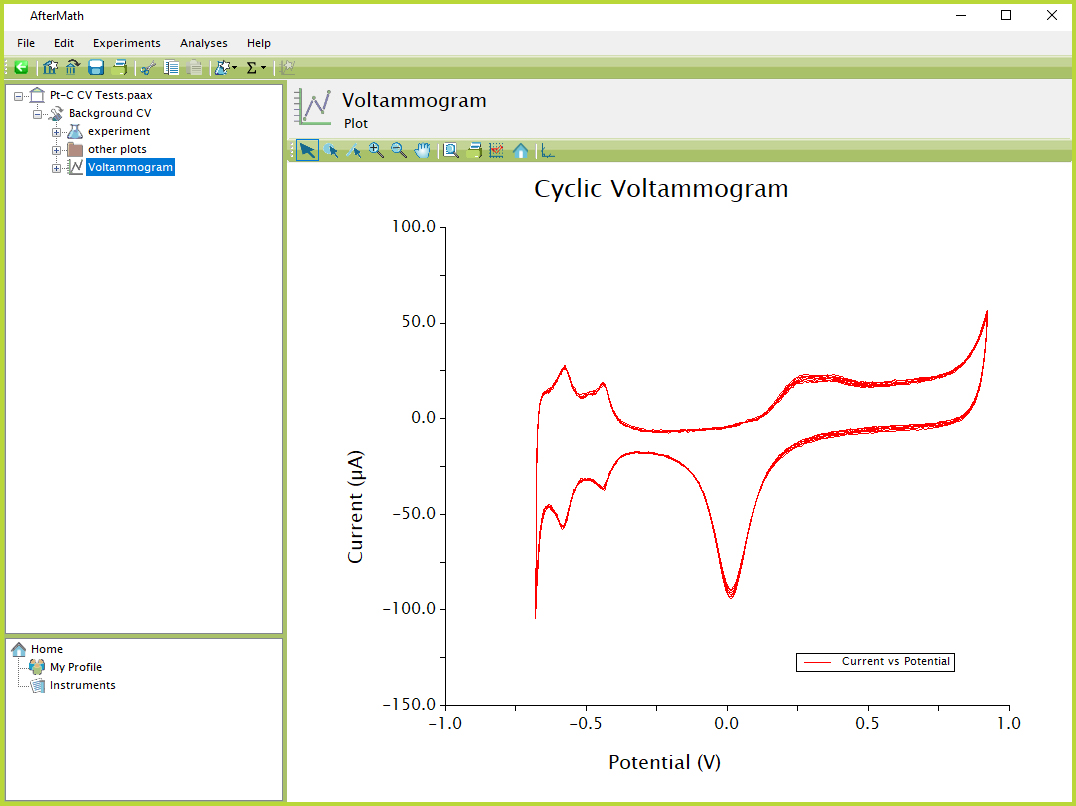
Figure 1. AfterMath Example Plot
By double-clicking the word "Voltammogram" in the left tree structure or simply clicking the icon, the plot node can be expanded to view the list of individual traces on the plot (see Figure 2). In the given example, there is only one trace present on the plot called "Current vs Potential". Clicking on the individual trace in the left tree structure allows the user to see several additional layers of detail, including visual options like the line and data point settings, the option to make the trace hidden, and a data table with values that can be copied and pasted similarly to a tabular data node.
 Tabular Data
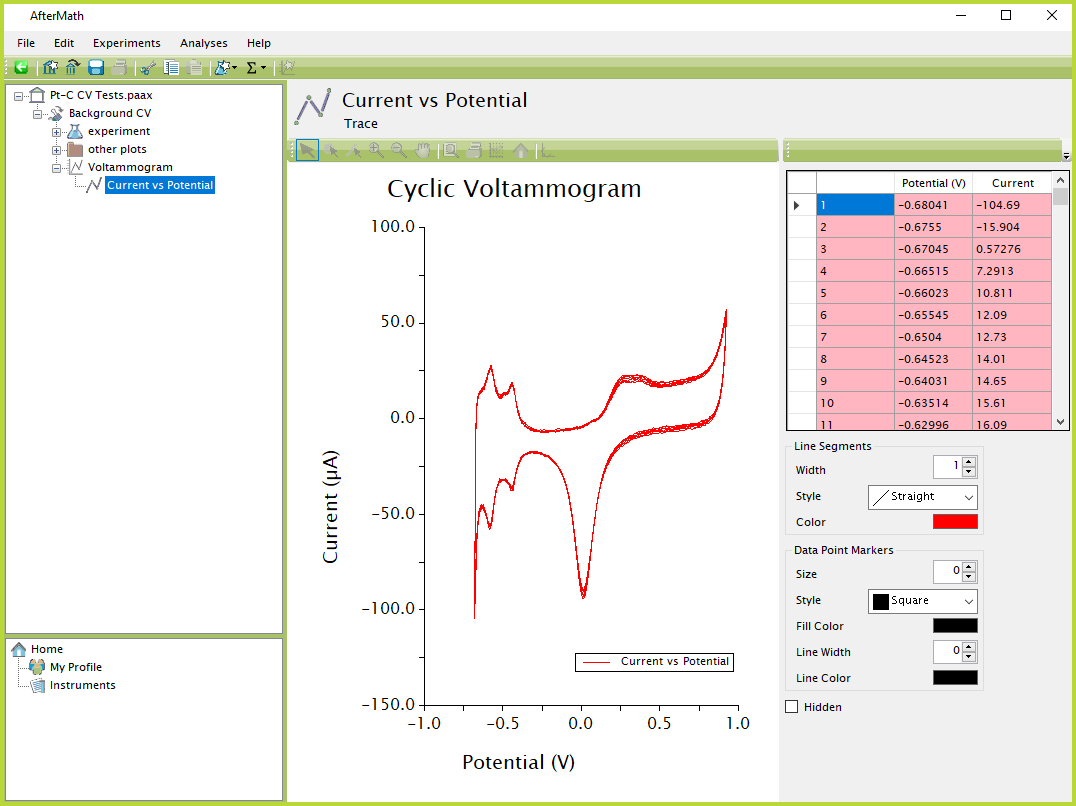
Figure 2. AfterMath Plot Trace View
One critical distinction to recognize when viewing a plot is that most actions - including selecting traces/segments/data points, copying and pasting, zooming and panning, adding tools, or adjusting axes - can only be performed when the primary plot node is selected from the left tree structure (Figure 1). When viewing an individual trace (Figure 2), other than the ability to change a few visual properties of that specific trace, no other adjustments to the plot can be made.
Plots can be quickly and easily copied and pasted from AfterMath into other applications by right-clicking on the plot and selecting the "Copy Plot" option (see Figure 3). This action places a bitmap image of the plot onto the system clipboard that can be pasted as an image into another application, such as a slideshow presentation program (see Figure 4).
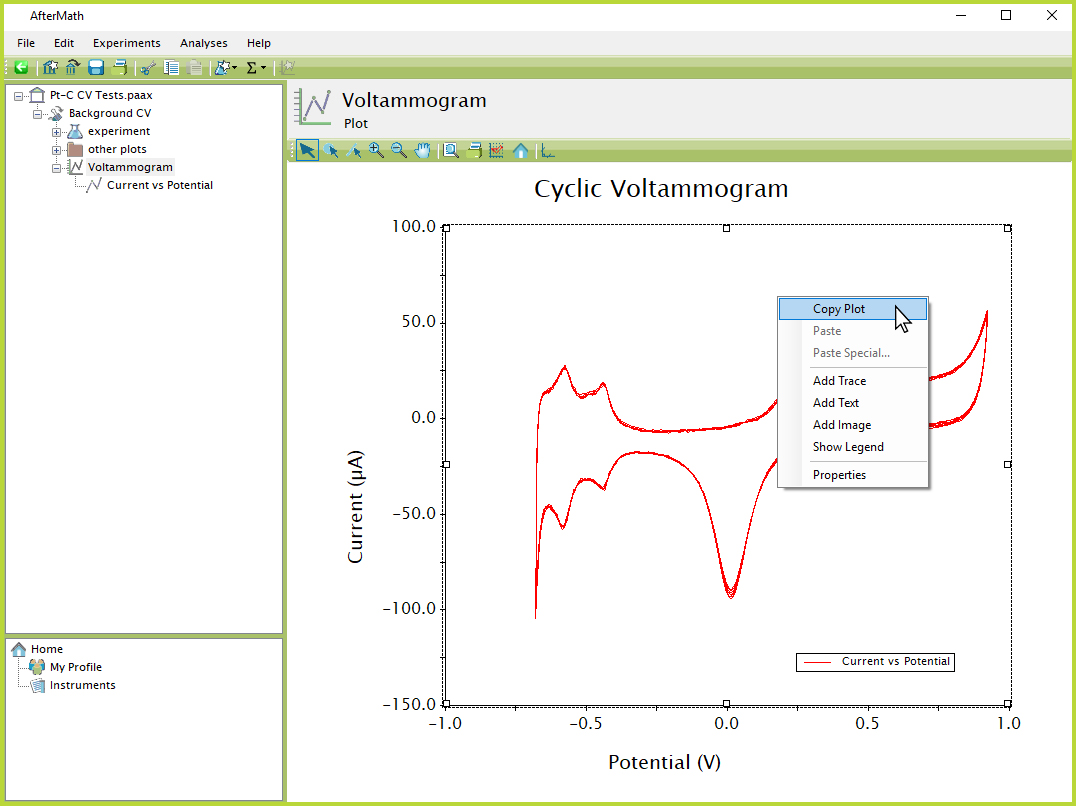
Figure 3. AfterMath Plot Copying
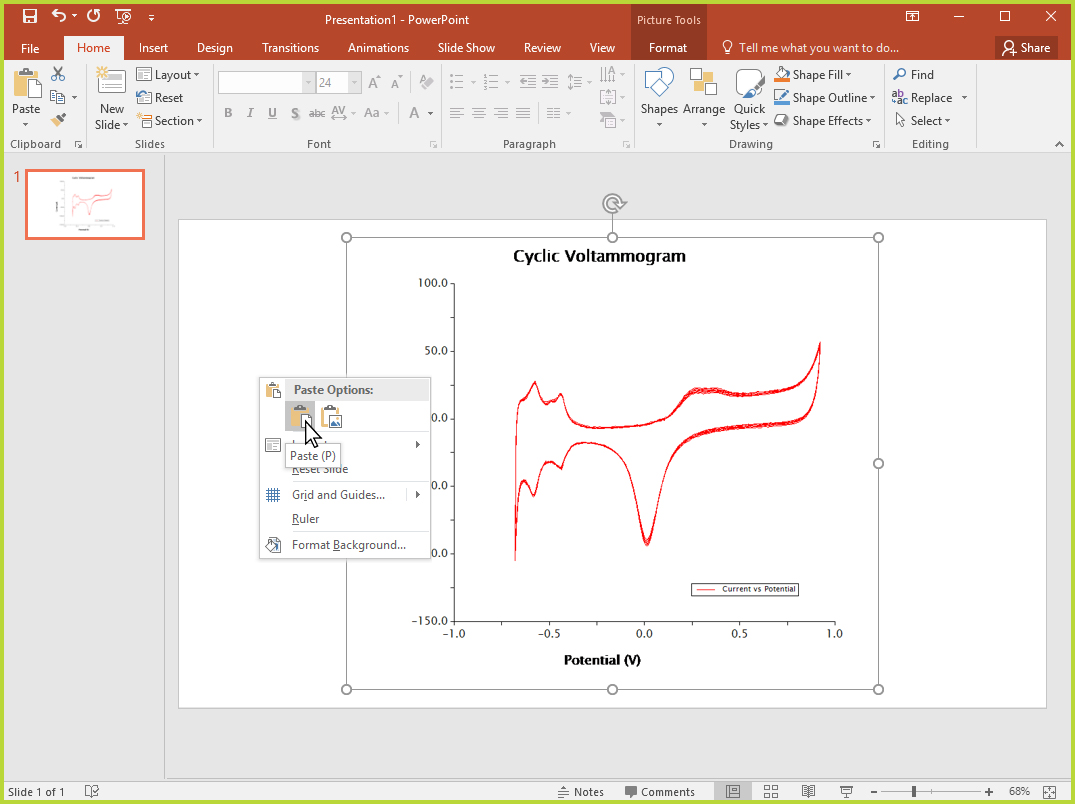
Figure 4. Copying AfterMath Plot into Another Program