


Tabular Data
Last Updated: 10/7/19 by Neil Spinner
1Tabular Data
Some experiments produce more complex relationships in the tabular data results. For example, an electrochemical impedance spectroscopy (EIS) experiment may generate many sets of relationships, including potential and current vs. time waveforms, Lissajous plots (a type of current vs. potential plot for EIS experiments), and post-processed results like impedance and phase angle.
Regardless of the complexity of data, whether raw or post-processed, the storage of these data is normally presented as sets of two-column numerical data in a node called "results" under the "experiment"
 Experiment
node, which is all within the study folder
Study
created upon the completion of an experiment (see Figure 1).
Experiment
node, which is all within the study folder
Study
created upon the completion of an experiment (see Figure 1).
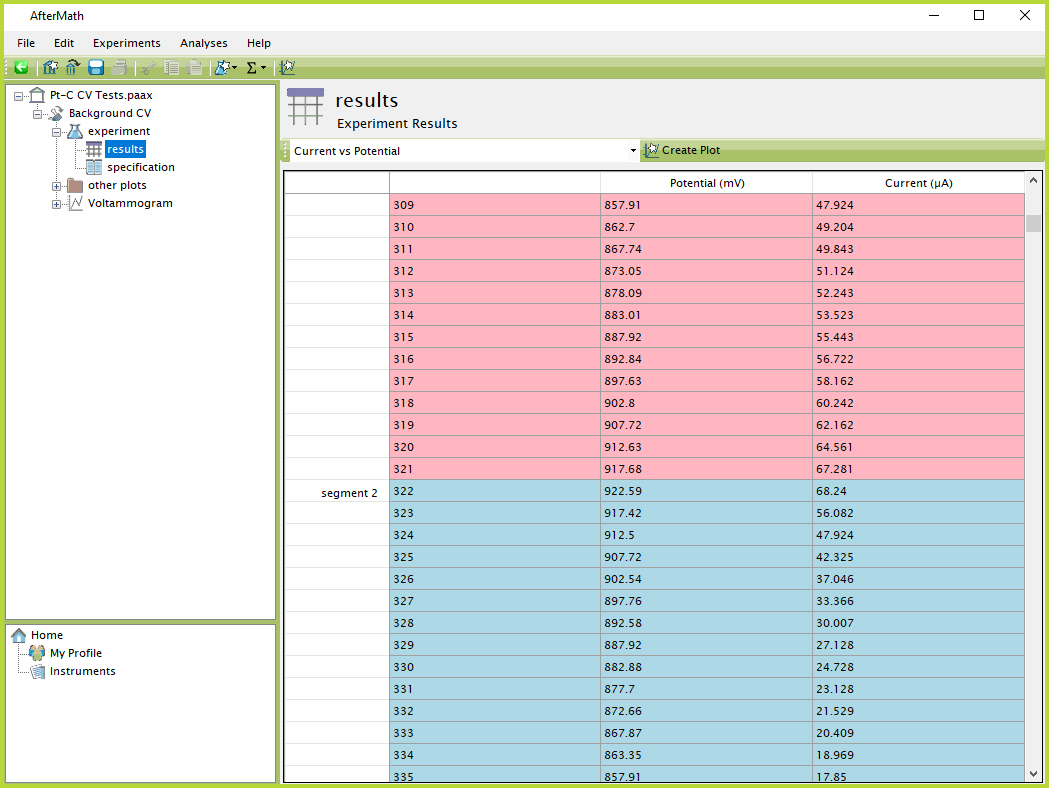
Figure 1. AfterMath Tabular Data Segments View
In the example shown in Figure 1, the type of experiment performed was cyclic voltammetry (CV)
Cyclic Voltammetry (CV)
consisting of multiple segments. AfterMath automatically shades the boxes for each segment a common color, alternating between pink and blue, to allow the user to more easily scroll quickly through the data and find the boundaries between adjacent segments.
Most often, an experiment generates more than one set of data from the related signals recorded during an experiment. AfterMath groups these sets of data together in the tabular data node. The drop-down list at the top of the tabular data can be used to switch between data sets (see Figure 2).
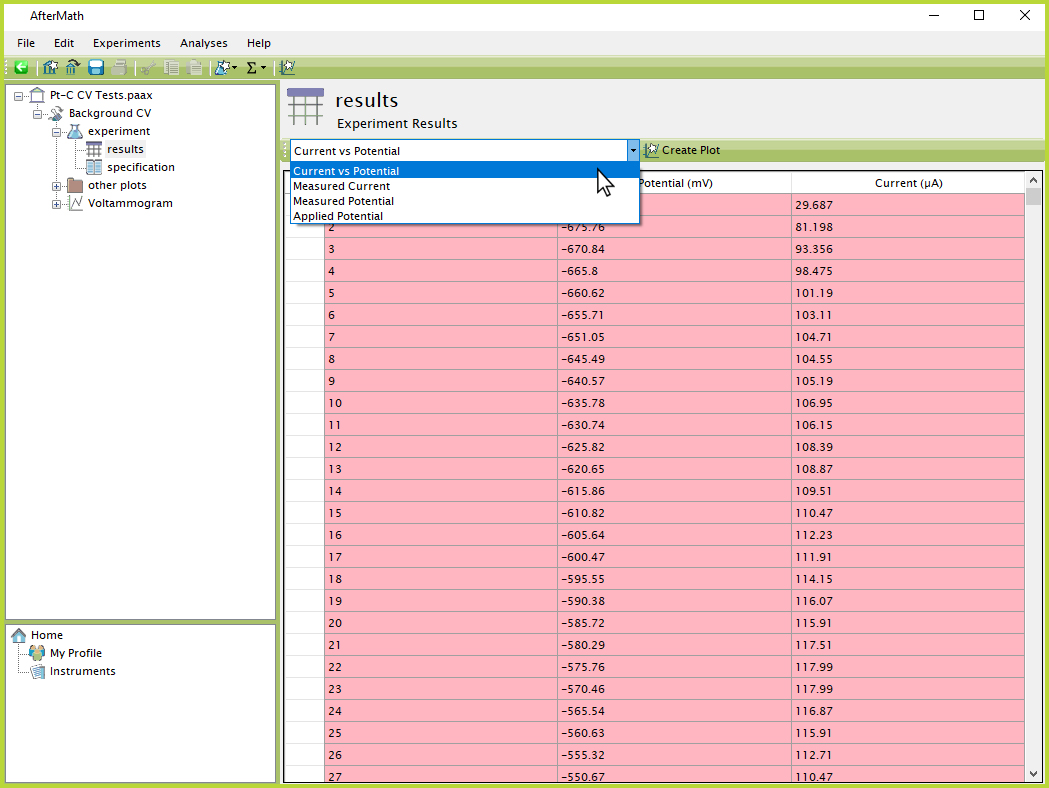
Figure 2. AfterMath Tabular Data Drop-Down
If a visual representation of any sets of raw data is desired, the user can select the "Create Plot" button just to the right of the drop-down list (see Figure 3). This automatically creates a new plot in the archive of the selected data set (see Figure 4).
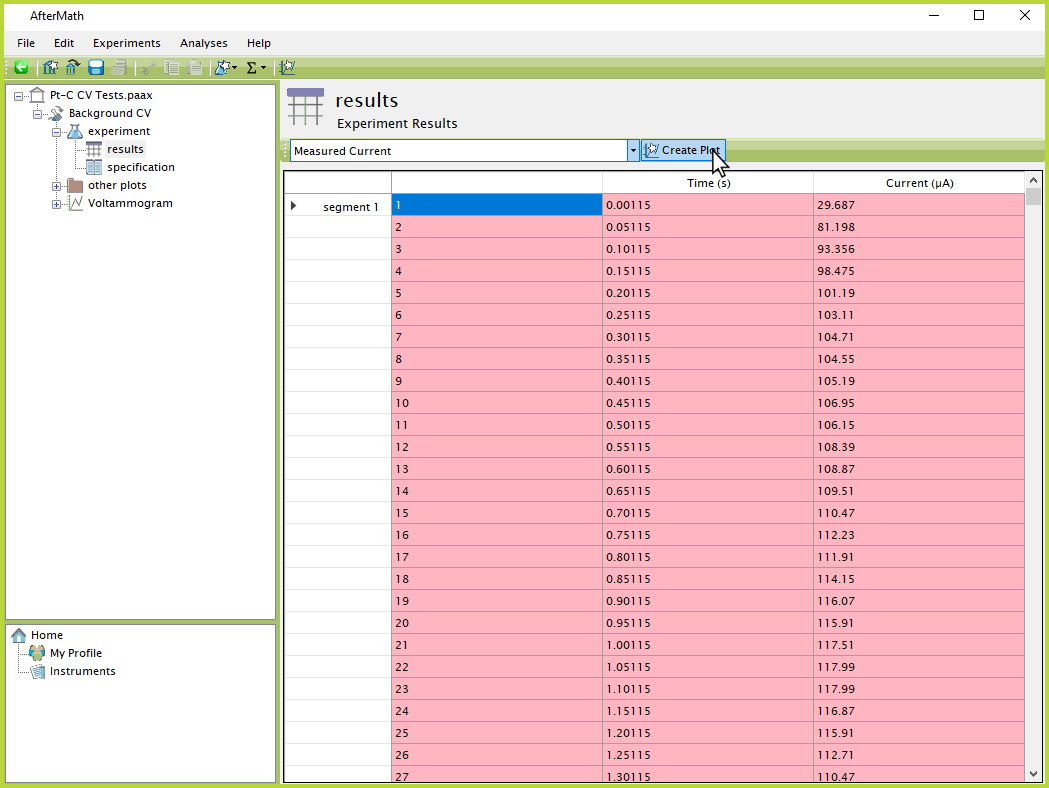
Figure 3. AfterMath Tabular Data Create Plot Button
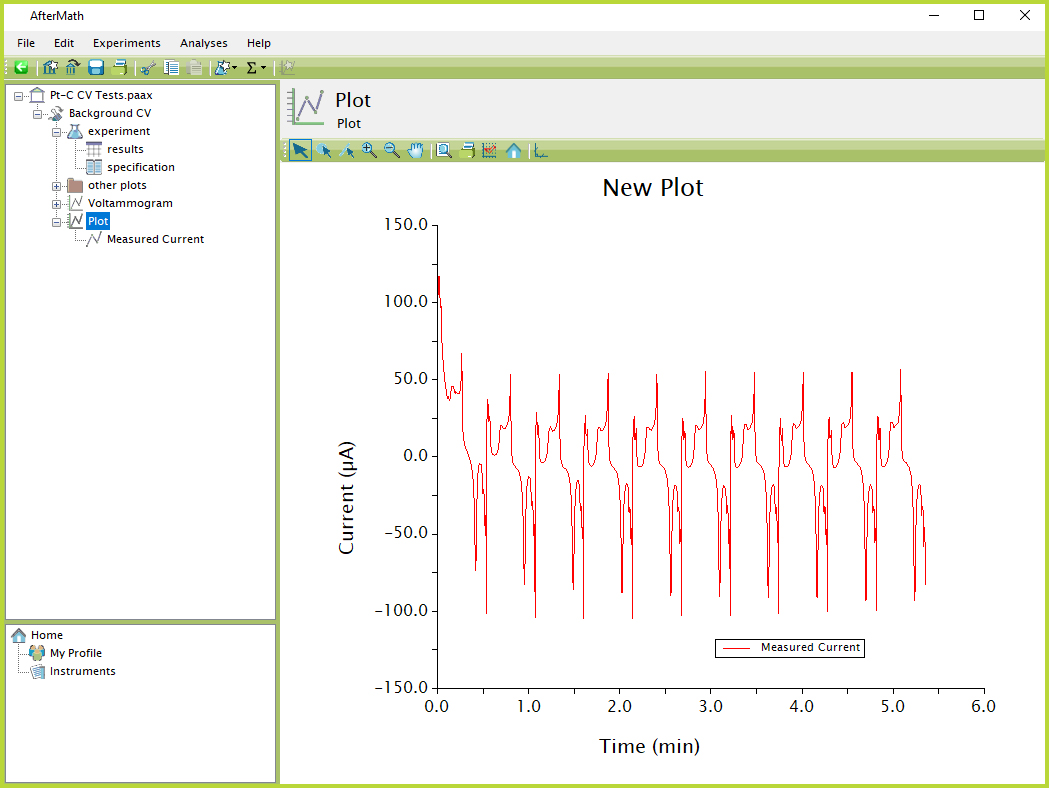
Figure 4. AfterMath New Plot from Tabular Data
In general, most AfterMath tabular data are permanently bound to experimental results and cannot be individually moved or copied. AfterMath requires such data tables to remain linked together with the experiment specification that was used to generate the data. However, in lieu of moving/copying the individual tabular data node, an entire experiment can usually be moved or copied. This action results in duplication or movement of the tabular data and specification such that the link between data and specification is not lost.
Data can be copied from a data table by simply dragging the mouse to select a desired set of rows and/or columns, then using the keyboard shortcut Ctrl+C to copy the selected data to the computer's clipboard. Data can then be pasted into most major word processing and spreadsheet programs for further analysis (see Figure 5).
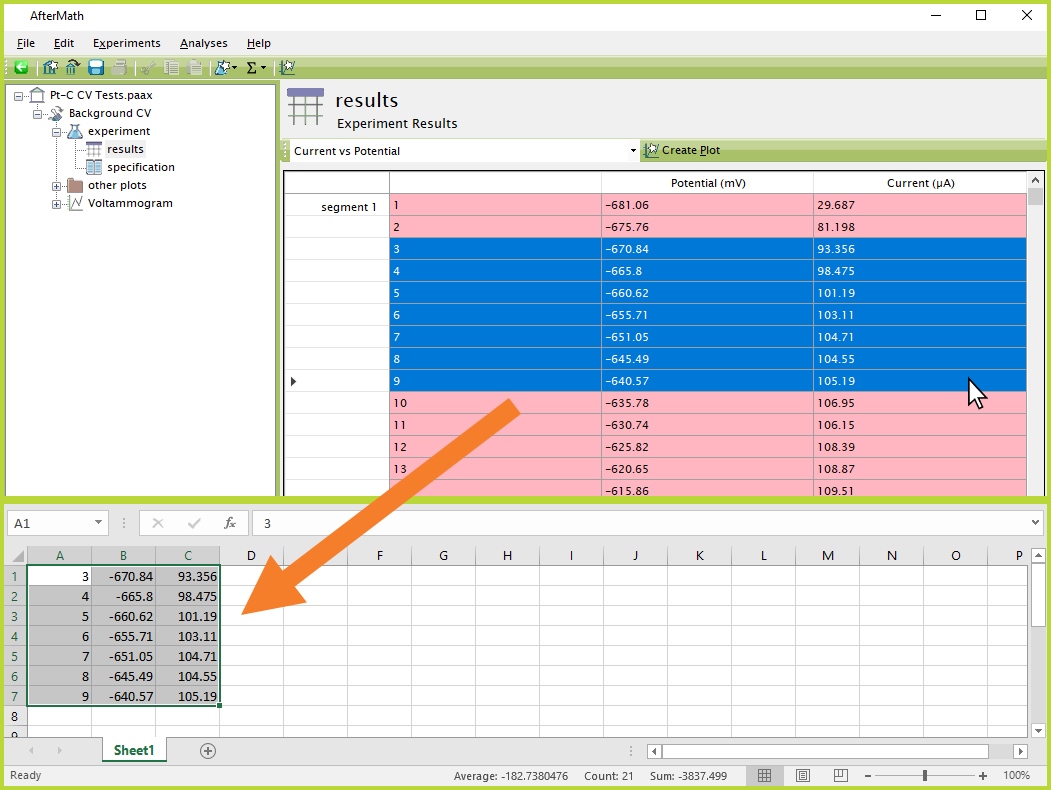
Figure 5. AfterMath Copy/Paste from Tabular Data
Since tabular data are usually bound to a particular experiment, it is not possible to delete an individual data table. However, it is usually possible to delete the entire experimental study itself from the archive. When deleting an experiment, both the tabular data and specification are removed from the archive.
AfterMath does not generally allow importing of data into a tabular data form from other sources. Plots can be easily created using external data, but the data will not exist in the tabular data style as with an experiment conducted in AfterMath from a Pine Research instrument directly. The main exception to this rule is EIS data, which can be imported using a special import feature
AfterMath EIS Data Import Procedure
that creates tabular data for the imported EIS data without being tied to an experimental specification.