


Creating a Plot
Last Updated: 3/15/21 by Tim Paschkewitz
1Creating a Plot from Tabular Data
The quickest way to create a plot is directly from a set of tabular data.
 Tabular Data
When viewing tabular data, a button appears at the top labeled "Create Plot" (see Figure 1):
Tabular Data
When viewing tabular data, a button appears at the top labeled "Create Plot" (see Figure 1):
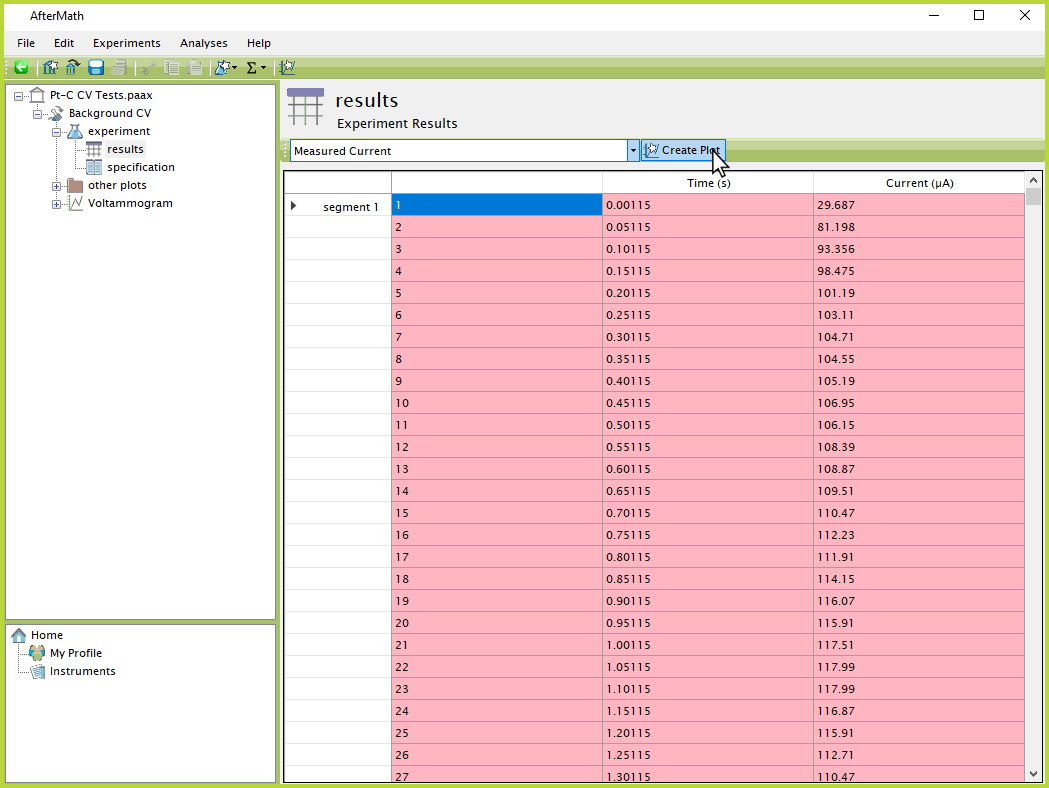
Figure 1. AfterMath Tabular Data Create Plot Button
Clicking this button creates a new plot with a single trace containing the tabular data (see Figure 2):
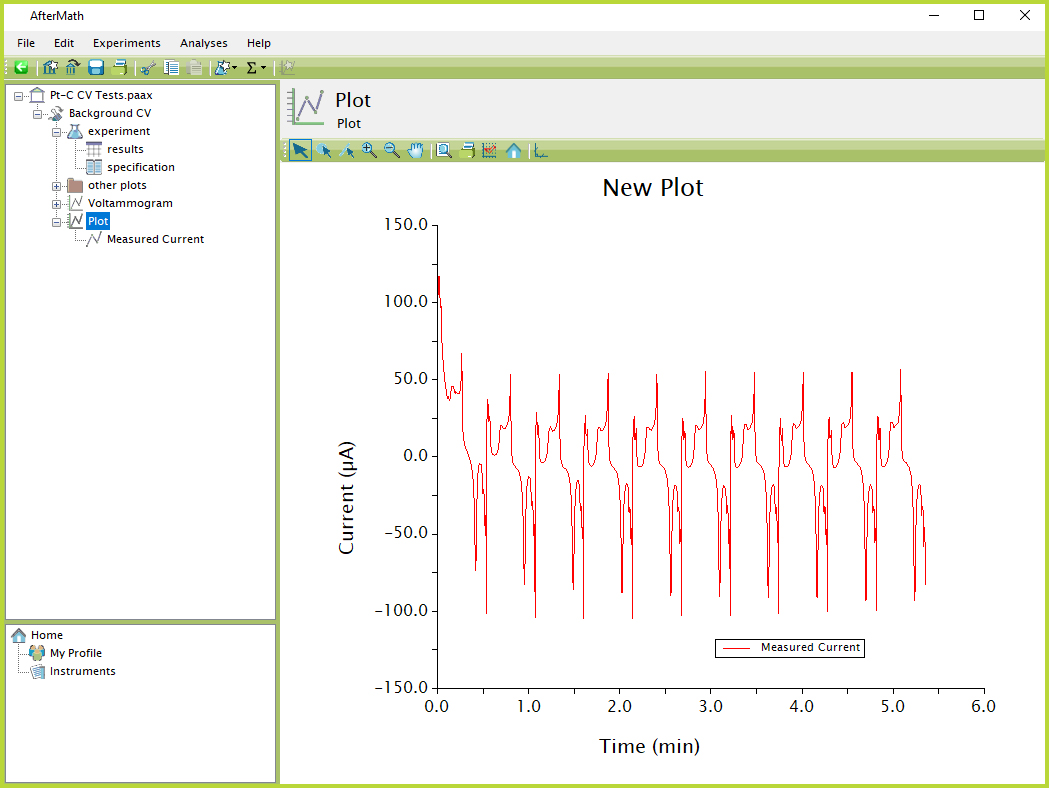
Figure 2. AfterMath New Plot from Tabular Data
2Creating an Empty Plot
There are a couple ways to create an empty plot in AfterMath. The first is by using the link that appears on the AfterMath Home screen (see Figure 3):
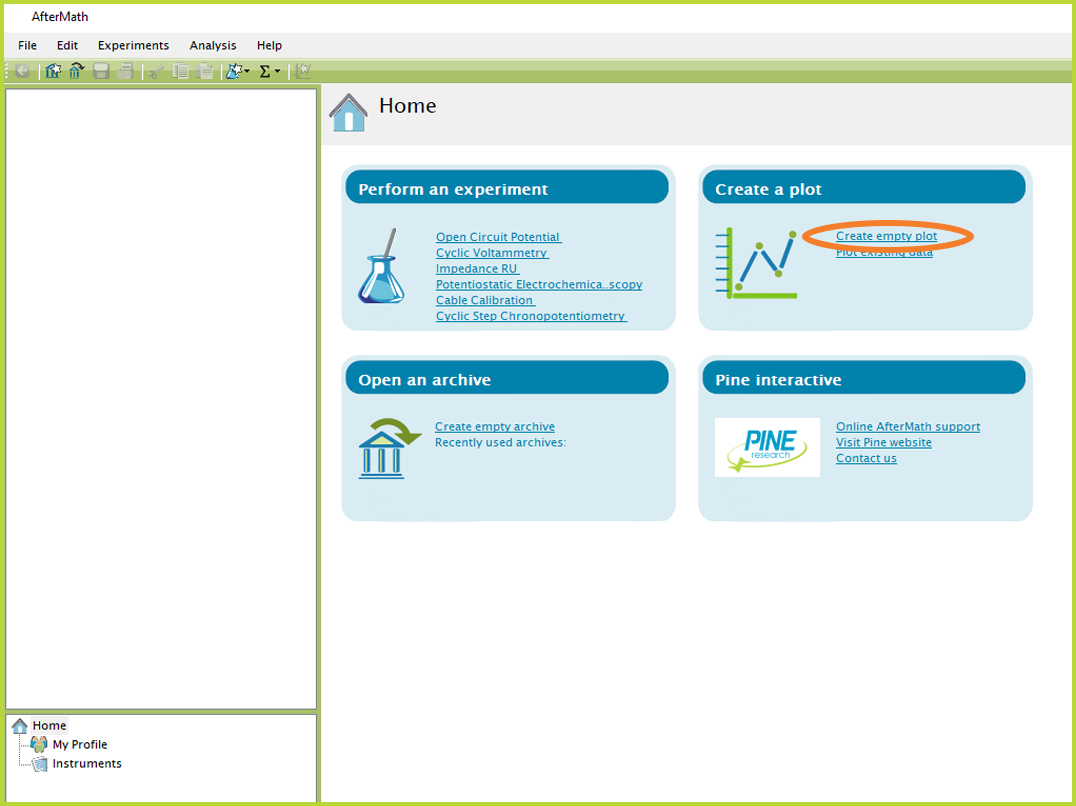
Figure 3. Creating New Plot from AfterMath Home Screen
Alternatively, with an archive open,
Creating a New Archive
right-click on the archive (or a subfolder
Folder
if desired), then select "New", then from the resulting submenu select "Plot" (see Figure 4):
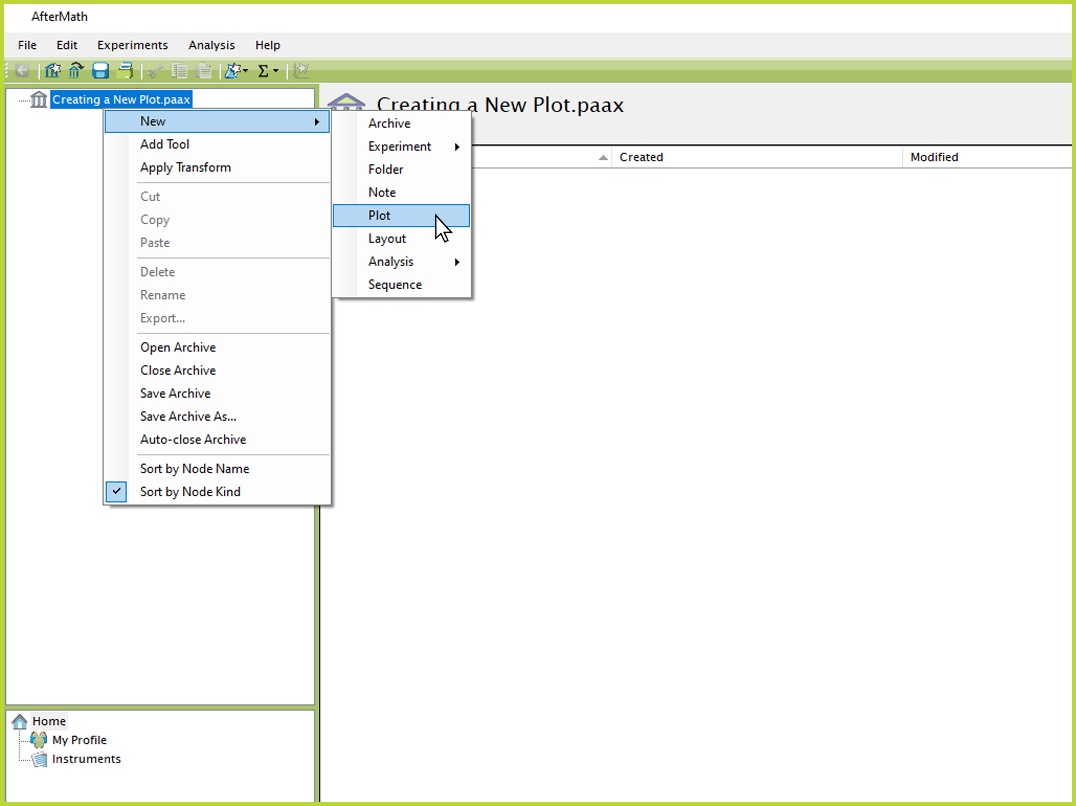
Figure 4. Creating New Plot from AfterMath Right-Click Menu
A newly-created plot in AfterMath is then generated (see Figure 5). Traces can be added to the plot in a variety of ways.
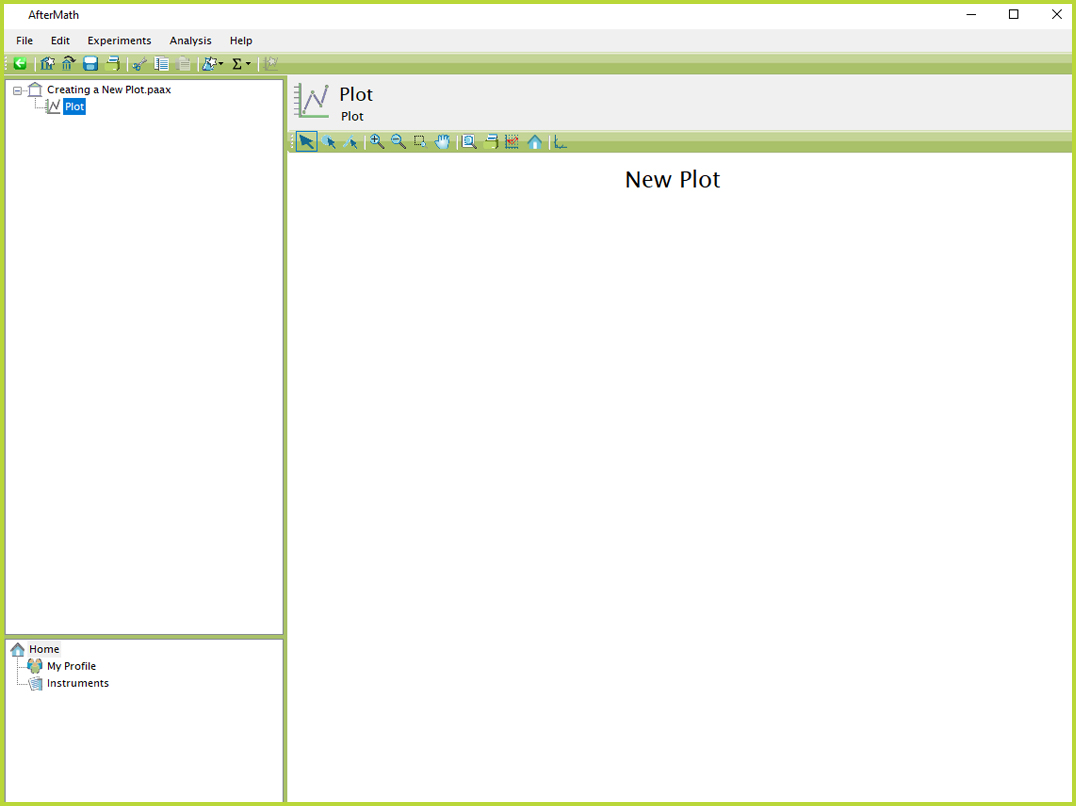
Figure 5. Newly-Created Blank Plot in AfterMath