


Plot Terminology
Last Updated: 9/23/20 by Neil Spinner
1Plot Terminology
AfterMath plots data as an experiment is progressing and allows the user to view the data in plots after an experiment has completed. The following terms will be defined herein:
- sheet
- plot area
- axis area
- data point
- trace
- point marker
- point connector
- plot axis
- major tick mark
- minor tick mark
- axis title
- axis unit
- trace segment
Plots are viewed on computer screens as well as printed sheets of paper. Because plots are frequently printed, it is useful to think of some aspects of plotting in terms of where the plot is located on a printed page.
The entire page on which the plot appears is called the sheet (blue-shaded region shown in Figure 1). The sheet often has the same aspect ratio as a standard paper size, but while viewing a plot on a computer screen the sheet size may be manipulated to any desired size that fits the display window.
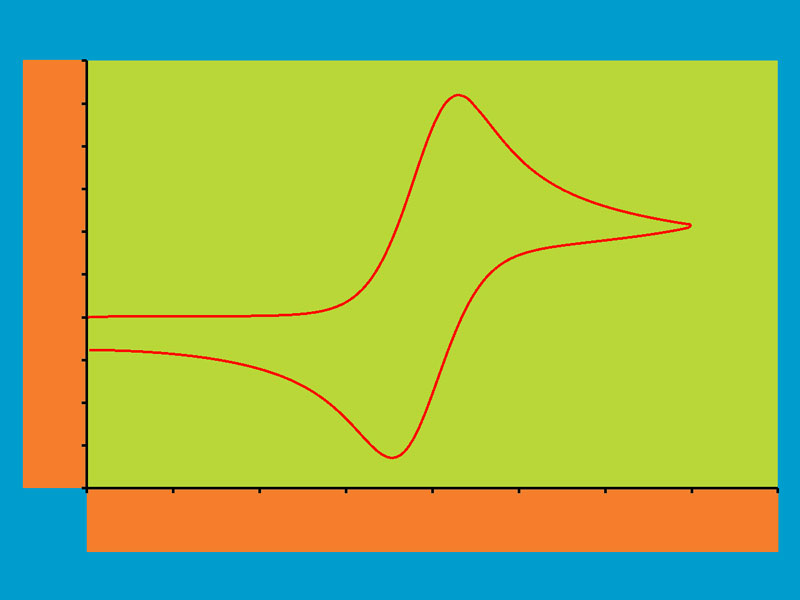
Figure 1. Color-Coded Plot in AfterMath
The region on the plot where data points are drawn (green-shaded region shown in Figure 1) is called the plot area. The plot area may be resized and moved to any location on the sheet. In general, it is a good idea to make the plot area as large as possible so that data points are easy to see.
Any region just outside the plot area where axis labels and an axis title are displayed is called the axis area (orange-shaded region shown in Figure 1). Most plots have two axis areas at the left and bottom, but some plots may have an additional vertical axis on the right (such as a Bode plot
 Bode Plot
for EIS
EIS Data Plotting
data) or horizontal axis at the top, and in these cases there may be three or four axis areas.
Bode Plot
for EIS
EIS Data Plotting
data) or horizontal axis at the top, and in these cases there may be three or four axis areas.
The smallest entity found on a plot is the single data point, representing the location of an ordered pair within the plot area. When a series of related data points are drawn on a plot in a manner intended to show that they are related, this series of points is collectively referred to as a trace.
The example plot shown in Figure 2 displays a small, zoomed in portion of a larger trace. The four visible data points on this trace are represented using a point marker. AfterMath has options for choosing the desired style of point marker for each trace (circle, square, diamond, etc.), and the fill color and border color may also be specified for most marker types. Each individual data point on a trace can be marked with a different point marker, they may all be marked with the same point marker, or no point marker can be used at all.
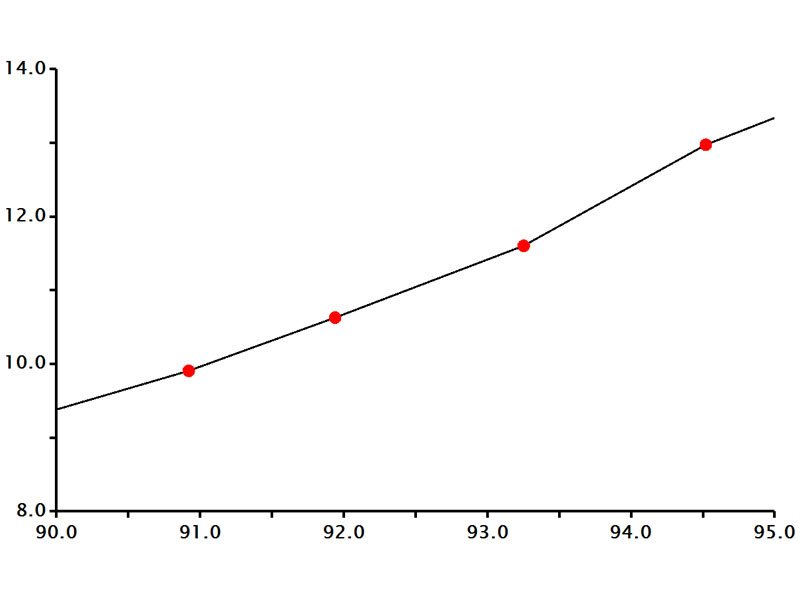
Figure 2. Zoomed In Portion of Trace Showing Data Points
The four data points shown in Figure 2 are connected together using black line segments called point connectors. AfterMath allows selection of line color and width for point connectors, or no point connectors can be used at all. In general, if a trace contains a large number of data points, it is common to not use point markers and to only draw point connectors.
Most plots have at least one visible plot axis. A plot axis is typically divided into regular intervals using tick marks. The tick marks that have a numeric tick mark label next to them are called major tick marks, while those that fall between labels are called minor tick marks (see Figure 3).
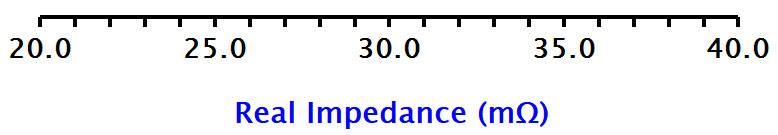
Figure 3. Example Plot Axis with Axis Title, Tick Mark Labels, and Tick Marks
It is a good practice for a plot axis to have an axis title to indicate the quantity being measured along the axis, and the title needs to include the scientific unit associated with the measurement, such as "Current (µA)" or "Real Impedance (mΩ)". The scientific unitused to scale the axis is called the axis unit. The axis unit should be chosen so that the numeric tick mark labels have a reasonable magnitude (i.e., units with excessive leading or trailing zeros should be avoided).
AfterMath supports breaking up a single trace into smaller pieces called trace segments. This concept is best illustrated using an example. The trace shown in Figure 4 represents two successive scans acquired during an electrochemical experiment. One of these scans has been selected and highlighted to distinguish it from the rest of the trace. This portion represents one of several trace segments that, taken together, comprise the entire trace.
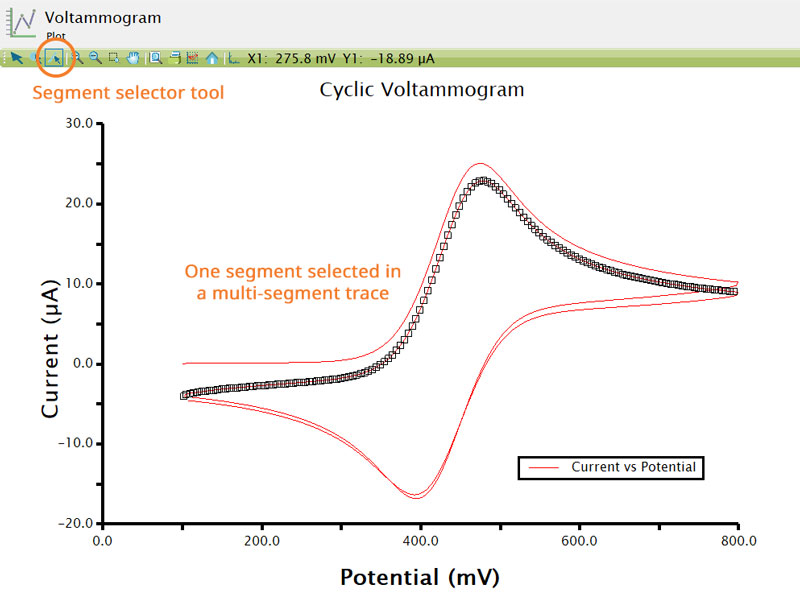
Figure 4. Trace Broken Up into Several Trace Segments
As a result of the potential being scanned back and forth during the experiment, the trace consists of several partially-overlapping scans. Due to the way the data from this experiment was recorded, AfterMath can distinguish between one scan and the next scan, treating each scan as a separate trace segment. AfterMath also includes a special "Segment Selector" tool (circled in orange on Figure 4) that permits selecting of data points in a single trace segment or from several specific trace segments.