Peak Height Tool
Last Updated: 1/5/23 by Alex Peroff

ARTICLE TAGS
-
peak,
-
measure peak,
-
AfterMath tools,
-
peak height
1General Overview
In many electrochemical experiments, users want to determine the peak height. Often, this peak height is a peak current (e.g., as in cyclic voltammetry,
differential plus voltammetry,
etc.). The baseline from which a peak is measured is important and cannot always be easily determined by software algorithms. Instead, AfterMath presents the users with the ability to establish both the baseline and define the peak as desired. The Peak Height tool provides the peak height (in y-axis units) and the peak position (in x-axis units) and can be finely adjusted as the user desires. For this knowledgebase article, the cyclic voltammogram of 2 mM Ru(NH3)6 in 0.2 M KNO3 shall be used for demonstration purposes (see Figure 1).
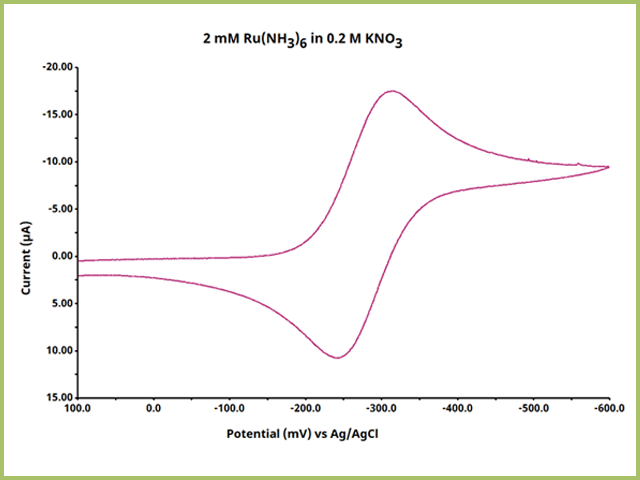
Figure 1. Cyclic Voltammogram of Ruthenium Hexaamine in Potassium Nitrate
2Step 1: Add Peak Height Tool
All tools are added to plots in the same manner. Select the plot in the left tree, then on the right of the screen, right-click the trace on the plot and select "Add Tool ► Peak Height" (see Figure 2).
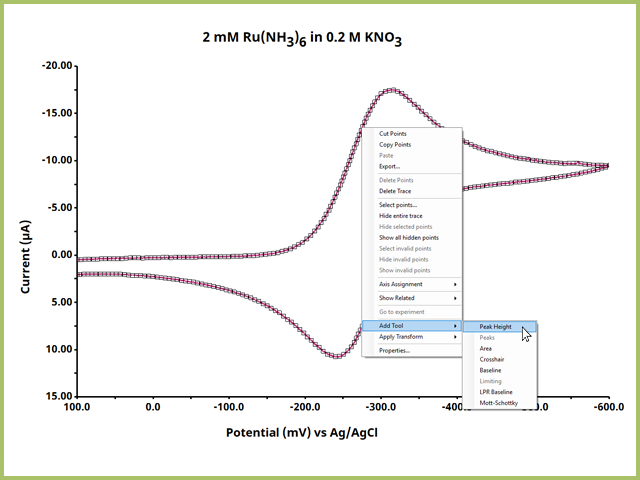
Figure 2. Add Peak Height Tool to Trace from Right-Click Menu
Immediately after selecting Peak Height, a pop-up window will ask about Boxcar Average
Size. Such a statistical tool is typically reserved for experiments using spectroscopy. Keep the size at zero and press OK.
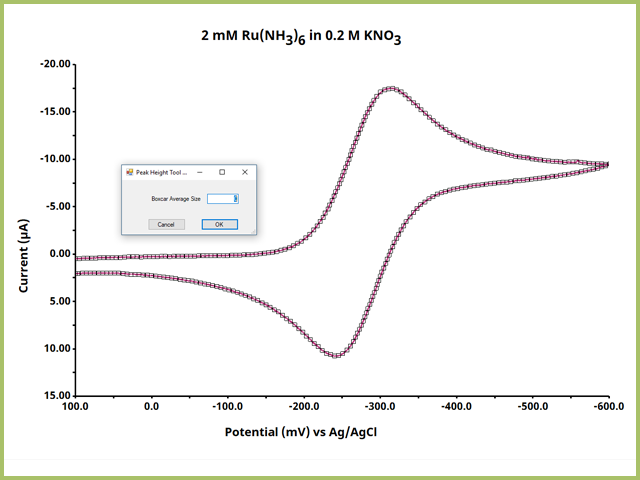
Figure 3. Boxcar Averaging Option for Peak Height Tool
Doing so will add three types of definition dots onto the trace include some dashed lines, which are as follows:
- The green definition dot (●) identifies the peak of interest
- The pink definition dot(s) (●) are used to define the baseline, from which the peak is measured
- The black definition dots (●) are used to adjust the baseline length, as desired
3Step 2: Adjust Definition Dots Accordingly
After the Peak Height Tool is on the trace, adjust the definition dots as needed. First, move the green dot (●) to the maximum height of the peak of interest (see Figure 4).
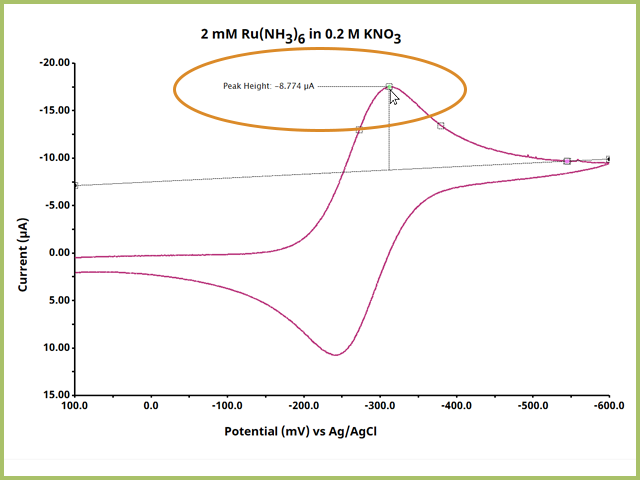
Figure 4. Adjust the Green Peak Definition Dot to the Peak Height of Interest
Notice that AfterMath immediately reports a peak height. Often, this may not be the optimal value as the leading baseline, from which the peak height is measured, has not been adequately defined. Right-click a pink dot and select Properties to open the Numeric Properties Box (see Figure 5).
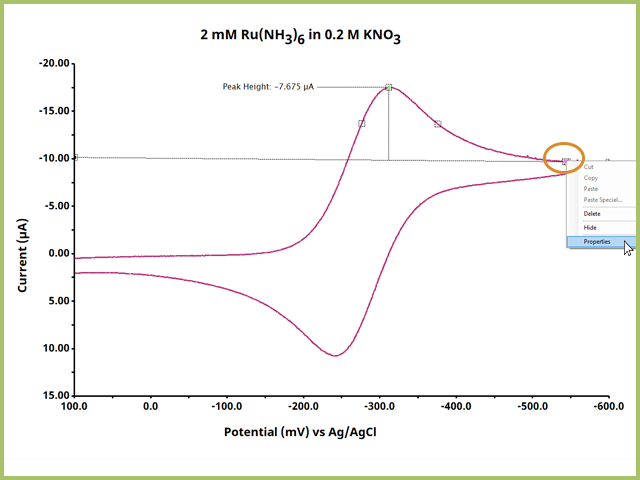
Figure 5. Adjust Baseline Properties by Right-Clicking a Pink Definition Dot
Doing so opens the "Numeric Properties" Dialog Window, which contains a variety of settings and options (see Figure 6).
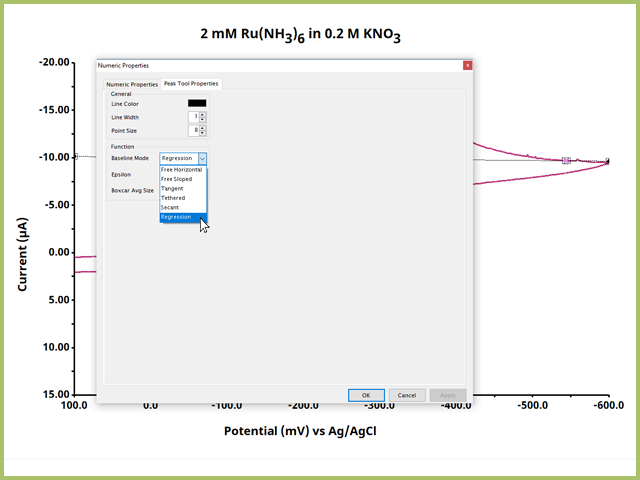
Figure 6. Baseline Definition Tool Numeric Properties Dialog WIndow
The Numeric Properties Dialog Window for the baseline definition contains several options that can be adjusted as desired. Of note is the "Baseline Mode" under the Function heading. Here, there are five options as follows:
- Free Horizontal - AfterMath draws a zero-slope (horizontal) line through only one pink dot. The pink dot can be located anywhere on the plot.
- Free Sloped - AfterMath draws a straight line between two pink dots. These pink dots can be located anywhere on the plot.
- Tethered - AfterMath requires one pink dot to be locked on real trace data while the other pink dot can be located anywhere on the plot.
- Secant - AfterMath draws a straight line between two pink dots. These pink dots must be locked on real trace data on the plot.
- Regression - AfterMath performs a linear regression about the data between two pink dots and draws the line from the regression. These pink dots must be locked on real trace data on the plot. This is the default and recommended baseline mode.
After selecting the desired baseline mode, press OK. Return to the plot and adjust the pink definition dots accordingly (see Figure 7). The baseline should be drawn from the leading current vs. potential data, before any significant increase in current. Ideally, the baseline has a zero slope at zero current, but in many applications such as low electrolyte or catalytic systems, a flat leading baseline may be difficult to obtain.
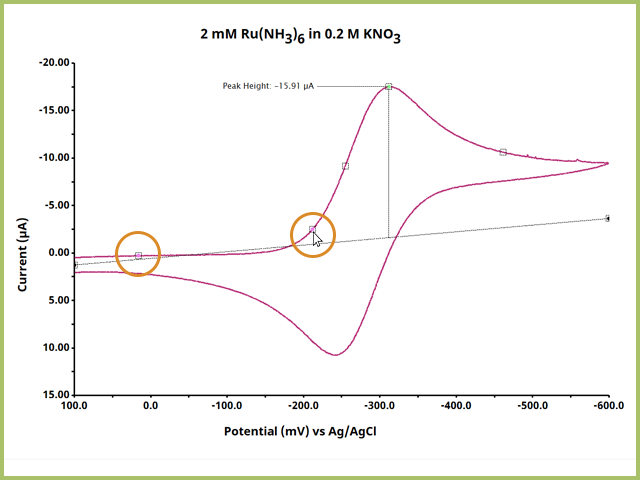
Figure 7. Adjust Pink Definition Dots for Baseline
Continue to adjust the pink dot(s) until you are satisfied with the leading baseline (see Figure 8). Notice that peak height value changes as a function of changing the baseline definition.
NOTE: When adjusting pink definition dots for the baseline, be advised that with most modes, the dots must be located within the same segment. For a cyclic voltammogram, for example, both dots must be on either the 1st or 2nd Segment. Moving the pink definition dots to two different segments will cause the points to snap into a position and you will have to start your definition process over.
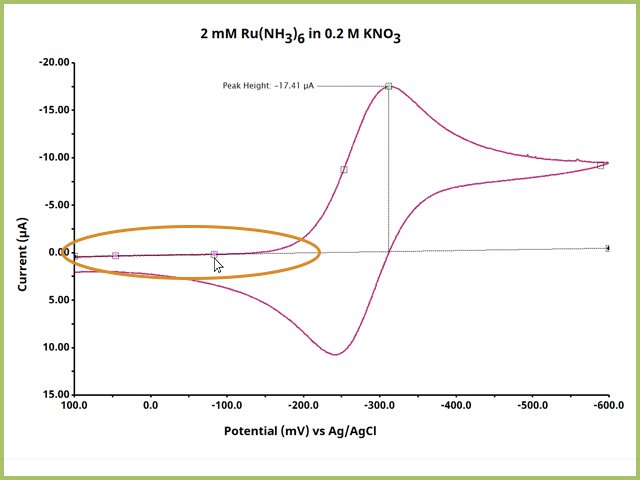
Figure 8. Ideal Placement of Baseline Definition Dots
4Step 3: Adjust Tool Display Properties
AfterMath peak height tool can display more information than simply the peak height (in current, for a cyclic voltammetry experiment). Additional measurement outputs for the peak height tool include the following:
- Peak Position - the x-axis position corresponding to the peak height (often in potential, for voltammetry based experiments)
- Peak Center - this output is not useful for most electrochemical methods but is often used for spectroscopy-based experiments
- Full Width at Half Maximum (FWHM) - this is the x-axis distance between the data at the horizontal line drawn at half of the peak height, as calculated from baseline. This is another measurement that is typically reserved for spectroscopy-based experiments.
To show these additional outputs, right-click on the peak height label and select properties (see Figure 9). This opens the Numeric Properties dialog window for the peak height output (see Figure 10).
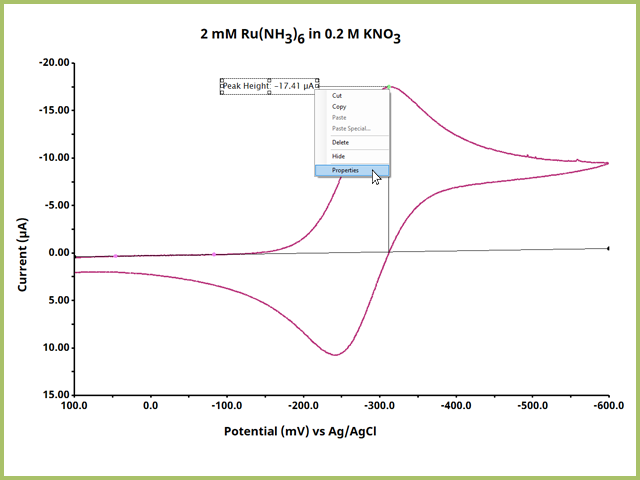
Figure 9. Right-Click the Peak Height Output Text to view Numeric Properties for the Peak Height Output
Many electrochemical users will want the peak position shown with the peak height. In the Numeric Properties Window, select the "Peak Position" tab in the lower half of the window and uncheck the box labeled "Hide this result (do not show labels, values, or unit)" an press OK. Doing so will show the peak position on the plot, along with Peak Height (see Figure 10).
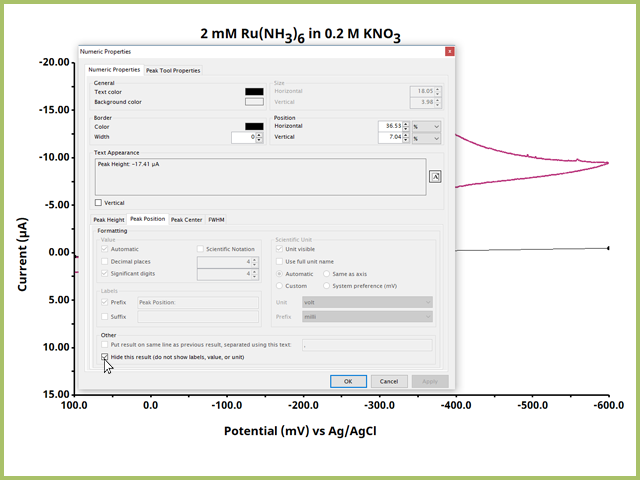
Figure 10. Numeric Properties Dialog WIndow for the Peak Height Tool Output Options
Repeat this process for other output values, as desired. Be advised you can also change the text (color, font, size, style) and box for the outputted values on the plot. The final result of finding peak height and peak position on a plot shows that while there are multiple steps involved in using the Peak Height Tool, the results are carefully cultivated and controlled by user input (see Figure 11).
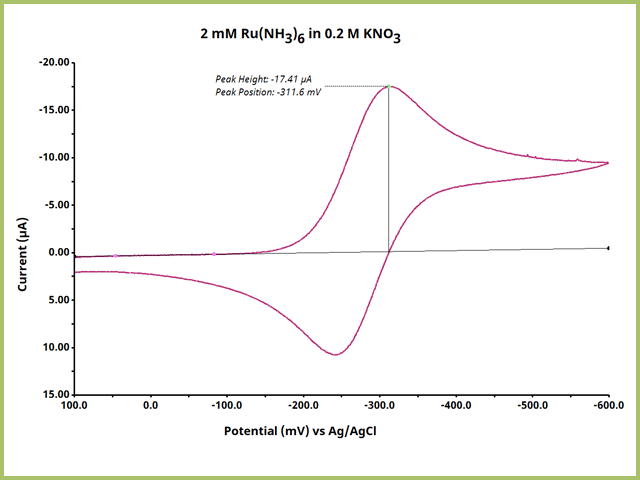
Figure 11. Ideal Peak Height Output on a Simple Cyclic Voltammogram
5Step 4: Apply to a Series of Traces
Apply steps 1 - 3 to any series of electrochemical data and separately record the data for further analysis. A common example is to verify Nernstian behavior of a reversible electrochemical redox couple by performing a scan rate study (for Cyclic Voltammetry). In a scan rate study, an electrochemical system is interrogated by CV with the nearly the same parameters (sweep limits) but the scan rate varies (see Figure 12).
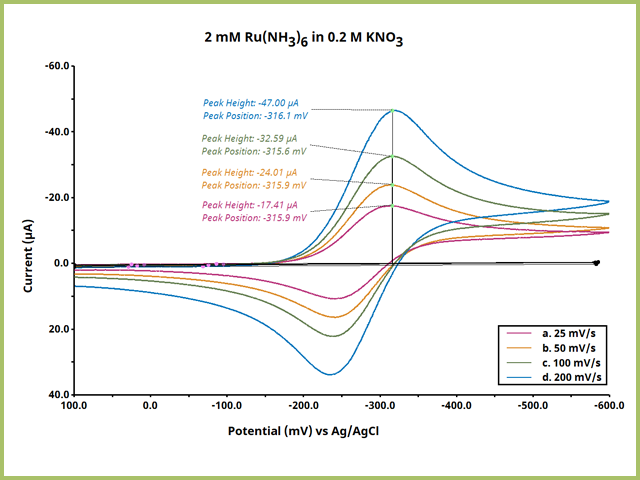
Figure 12. Scan Rate Comparision Cyclic Voltammetry Overlay
Such an experiment yields empirical data by which to analyze with the Randles-Sevcik equation,
which describes that in cyclic voltammetry for a reversible electrochemical reaction, peak current

is proportional to the square root of scan rate

.


