


Electrochemical-Enzymatic Determination of Glucose in Beverages
Last Updated: 5/3/19 by Neil Spinner
Download as PDF1Abstract
This laboratory seeks to quantitatively determine glucose concentration in common beverages. The method employed is enzyme-catalyzed oxidation of glucose, quantified by chronoamperometry.
 Chronoamperometry (CA)
With an inexpensive patterned electrode and low cost glucose oxidase enzyme, an electrochemical sensor is constructed to selectively measure glucose in complicated beverages that can present as analytically-challenging matrices. This lab briefly discusses conceptual information about sugars used to sweeten common beverages, enzyme-substrate interactions, glucose mutarotation, enzyme kinetics, and electroanalysis.
Chronoamperometry (CA)
With an inexpensive patterned electrode and low cost glucose oxidase enzyme, an electrochemical sensor is constructed to selectively measure glucose in complicated beverages that can present as analytically-challenging matrices. This lab briefly discusses conceptual information about sugars used to sweeten common beverages, enzyme-substrate interactions, glucose mutarotation, enzyme kinetics, and electroanalysis.
2Introduction
Bioanalytical chemistry, a sub-discipline of analytical chemistry, uses quantitative and qualitative methods of analysis to evaluate biological-based chemical species. These biological species are commonly found in complicated matrices such as blood and may include proteins, drug metabolites, and sugars.
In a complicated matrix such as blood, it is difficult to quantitatively determine the presence and concentration of target analytes. Therefore, the matrix is often simplified by chemical separations (e.g., HPLC, GC, electrophoresis) prior to quantitative determination.
Another manner to quantify an analyte among several interferents is by increasing selectivity. Many enzymes and substrates function as a lock and key gateway. The enzyme catalyzes a reaction only when a very specific substrate binds to its active site.
Such is the case for glucose oxidase and its substrate, β-D-glucose. Therefore, despite a complicated matrix of chemical species, an assay based on glucose oxidase will only have an analytical signal from β-D-glucose (see Figure 1).
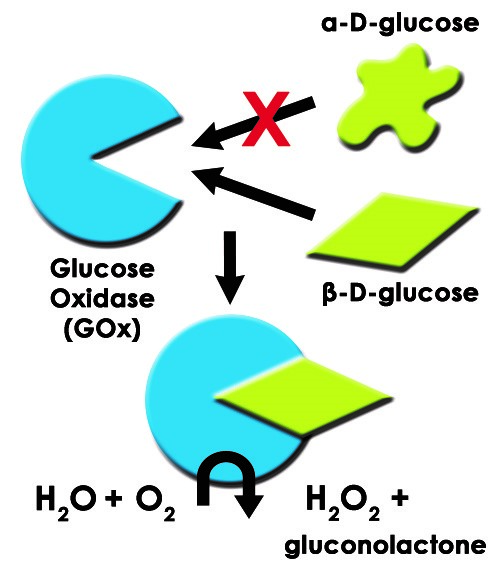
Figure 1. Diagram of Glucose Oxidase Enzyme with Substrate ß-D-glucose and Product H2O2
Electrochemical methods are highly sensitive. Use of electrochemistry with enzymes as described above adds selectivity. Therefore, in complicated matrices (such as common soft drinks, which could contain caffeine, sugars, preservatives, water, colorings, acids, and other chemicals), electrochemical determination of the extent of an enzymatic reaction is a sensitive and selective method by which to determine glucose concentration.
The assay described here uses glucose oxidase to catalyze the oxidation of β-D-glucose to gluconolactone (GNL), with hydrogen peroxide (H2O2) as a byproduct (see Figure 1). The hydrogen peroxide is electrochemically detected at a platinum electrode. The current from hydrogen peroxide oxidation is calibrated against standard glucose solutions to construct a calibration curve and determine the unknown glucose concentration.
3Biochemistry Background
The United States Food and Drug Administration (FDA) does not have stringent policies on nutritional label reporting of sugars (see Figure 2).
 U.S. Government. Title 21 – Food and Drugs. https://www.govinfo.gov/content/pkg/CFR-2008-title21-vol2/pdf/CFR-2008-title21-vol2-part101-subpartA.pdf.
On a nutritional label, the entry for “Sugars” under Total Carbohydrate may include any of the following naturally occurring or artificially added sugars: fructose, glucose, sucrose, and dextrose, and in one of several forms (crystalline, as in sugar crystals, or liquid, as in high fructose corn syrup). Any sugars added to the product must be stated on the ingredients list. While a general consumer is made aware of added sugars and total mass of sugar per serving, the customer does not know the concentration or ratios of the sugars present.
Ventura, E. E.; Davis, J. N.; Goran, M. I. Sugar Content of Popular Sweetened Beverages Based on Objective Laboratory Analysis: Focus on Fructose Content. Obesity, 2011, 19(4), 868–874.
U.S. Government. Title 21 – Food and Drugs. https://www.govinfo.gov/content/pkg/CFR-2008-title21-vol2/pdf/CFR-2008-title21-vol2-part101-subpartA.pdf.
On a nutritional label, the entry for “Sugars” under Total Carbohydrate may include any of the following naturally occurring or artificially added sugars: fructose, glucose, sucrose, and dextrose, and in one of several forms (crystalline, as in sugar crystals, or liquid, as in high fructose corn syrup). Any sugars added to the product must be stated on the ingredients list. While a general consumer is made aware of added sugars and total mass of sugar per serving, the customer does not know the concentration or ratios of the sugars present.
Ventura, E. E.; Davis, J. N.; Goran, M. I. Sugar Content of Popular Sweetened Beverages Based on Objective Laboratory Analysis: Focus on Fructose Content. Obesity, 2011, 19(4), 868–874.
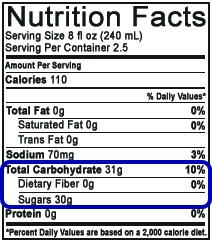
Figure 2. Example of U.S. Nutrition Facts on Edible Consumer Goods
3.1Types of Sugars
3.1.1Fructose
Fructose is also called “fruit sugar” as it is the predominant natural sugar found in plant products such as berries, flowers, and root vegetables (see Figure 3). For use in processed foods, fructose is commonly obtained from sugar cane and sugar beets.
Ventura, E. E.; Davis, J. N.; Goran, M. I. Sugar Content of Popular Sweetened Beverages Based on Objective Laboratory Analysis: Focus on Fructose Content. Obesity, 2011, 19(4), 868–874.
Hanover, L. M.; White, J. S. Manufacturing, composition, and applications of fructose. The American Journal of Clinical Nutrition, 1993, 58(5 Suppl), 724S-732S.
Nelson, D. L.; Cox, M. M. Lehninger Principles of Biochemistry, 6th ed. W.H. Freeman {&} Company, 2012.
Hanover, L. M.; White, J. S. Manufacturing, composition, and applications of fructose. The American Journal of Clinical Nutrition, 1993, 58(5 Suppl), 724S-732S.
Nelson, D. L.; Cox, M. M. Lehninger Principles of Biochemistry, 6th ed. W.H. Freeman {&} Company, 2012.
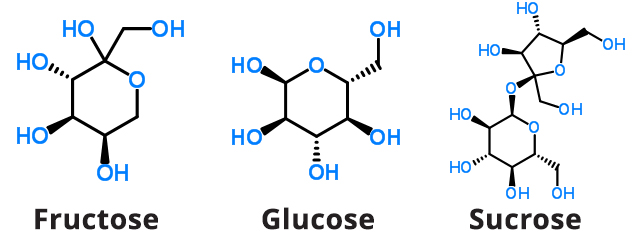
Figure 3. Chemical Structures of Fructose, Glucose, and Sucrose
When compared to other sugars, fructose is the sweetest tasting.
Hanover, L. M.; White, J. S. Manufacturing, composition, and applications of fructose. The American Journal of Clinical Nutrition, 1993, 58(5 Suppl), 724S-732S.
It is a monosaccharide, the most basic unit of a carbohydrate. It is absorbed directly into the bloodstream when consumed by humans and does not elicit a release of insulin from the pancreas.
3.1.2Glucose
Glucose is also a monosaccharide and is the primary source of cellular energy in plants and animals (see Figure 3). Commercially, glucose added to foods is most often sourced from grains, with corn being used most often. Glucose enters the bloodstream after processing through the gut and liver.
Ventura, E. E.; Davis, J. N.; Goran, M. I. Sugar Content of Popular Sweetened Beverages Based on Objective Laboratory Analysis: Focus on Fructose Content. Obesity, 2011, 19(4), 868–874.
Hanover, L. M.; White, J. S. Manufacturing, composition, and applications of fructose. The American Journal of Clinical Nutrition, 1993, 58(5 Suppl), 724S-732S.
Perles, C. E.; Volpe, P. L. O. A Simple Laboratory Experiment To Determine the Kinetics of Mutarotation of D-Glucose Using a Blood Glucose Meter. J. Chem. Educ., 2008, 85(5), 686.
3.1.3Sucrose
Sucrose, commonly referred to as “white” or “table” sugar, is also a monosaccharide and is a source of cellular energy in plants and animals (see Figure 3). Commercially, sucrose added to foods is most often sourced from grains, with corn being used most often. Sucrose enters the bloodstream after processing through the gut and liver.
Ventura, E. E.; Davis, J. N.; Goran, M. I. Sugar Content of Popular Sweetened Beverages Based on Objective Laboratory Analysis: Focus on Fructose Content. Obesity, 2011, 19(4), 868–874.
Hanover, L. M.; White, J. S. Manufacturing, composition, and applications of fructose. The American Journal of Clinical Nutrition, 1993, 58(5 Suppl), 724S-732S.
Perles, C. E.; Volpe, P. L. O. A Simple Laboratory Experiment To Determine the Kinetics of Mutarotation of D-Glucose Using a Blood Glucose Meter. J. Chem. Educ., 2008, 85(5), 686.
Hanover, L. M.; White, J. S. Manufacturing, composition, and applications of fructose. The American Journal of Clinical Nutrition, 1993, 58(5 Suppl), 724S-732S.
Perles, C. E.; Volpe, P. L. O. A Simple Laboratory Experiment To Determine the Kinetics of Mutarotation of D-Glucose Using a Blood Glucose Meter. J. Chem. Educ., 2008, 85(5), 686.
3.2High Fructose Corn Syrup
In recent years, processed food manufacturers use high fructose corn syrup (HFCS) in lieu of sucrose as a sweetener. Both consist of glucose and fructose, but HFCS is less costly due to governmental corn subsidies. In humans, sucrose is broken down to glucose and fructose which are processed as monosaccharaides.
Ventura, E. E.; Davis, J. N.; Goran, M. I. Sugar Content of Popular Sweetened Beverages Based on Objective Laboratory Analysis: Focus on Fructose Content. Obesity, 2011, 19(4), 868–874.
Hanover, L. M.; White, J. S. Manufacturing, composition, and applications of fructose. The American Journal of Clinical Nutrition, 1993, 58(5 Suppl), 724S-732S.
Nelson, D. L.; Cox, M. M. Lehninger Principles of Biochemistry, 6th ed. W.H. Freeman {&} Company, 2012.
Hanover, L. M.; White, J. S. Manufacturing, composition, and applications of fructose. The American Journal of Clinical Nutrition, 1993, 58(5 Suppl), 724S-732S.
Nelson, D. L.; Cox, M. M. Lehninger Principles of Biochemistry, 6th ed. W.H. Freeman {&} Company, 2012.
HFCS is a mixture of the monosaccharide sugars glucose and fructose. Often, HFCS is used in processed foods because it is less expensive than sucrose. Commonly, perceived sweetness of sugars is based relative to sucrose. Sucrose has a rating of 1 on the “sweetness scale,” while glucose and fructose are rated 0.74 - 0.8 and 1.17 - 1.75, respectively.
Perles, C. E.; Volpe, P. L. O. A Simple Laboratory Experiment To Determine the Kinetics of Mutarotation of D-Glucose Using a Blood Glucose Meter. J. Chem. Educ., 2008, 85(5), 686.
HFCS formulations are prepared and named based on their content of fructose. A common blend of HFCS used in soft drinks is HFCS55, which means it contains 55% fructose and 42% glucose in water (with the balance being maltose). Based on relative sweetness, HFCS55 provides sweetness similar to pure sucrose.
Consider the sugar content of a cola carbonated beverage. The label states that a can with volume 355 mL contains 39 g sugar. According to the ingredient label, the sugars are from HFCS. Therefore, the effective glucose concentration in such a can would be 16.4 g (0.42 × 39 g = 16.4 g).
For quantification of glucose, it is important to realize that the sugar content listed on a can of carbonated beverage sweetened with HFCS55 is not solely due to glucose. In this lab, only glucose, and more specifically only β-D-glucose (the substrate for the enzyme glucose oxidase) is the analyte of interest.
3.3Glucose Mutarotation
Two stereoisomers of glucose are D-glucose and L-glucose. The D or L designation with glucose refers to the asymmetric carbon farthest from the aldehyde or keto group. Most naturally occurring sugars are D isomers. D and L sugars are mirror images of one another. D-glucose is the isomer found in nature and in nutritive sweeteners. D-glucose can exist in an open chain and closed chain form, the former being thermodynamically unstable.
When a solution of D-glucose is prepared in water, there is a dynamic equilibrium between the open chain and closed chain forms α-D-glucose and β-D-glucose.
Perles, C. E.; Volpe, P. L. O. A Simple Laboratory Experiment To Determine the Kinetics of Mutarotation of D-Glucose Using a Blood Glucose Meter. J. Chem. Educ., 2008, 85(5), 686.
The cyclic forms of carbohydrates can exist in two forms, α- and β-, based on the position of the substituent (OH-) at the anomeric center. The α- and β- forms are sometimes described as anomers since they are isomers at the anomeric center.
Because the open chain is not thermodynamically stable, an equilibrium mixture between the α-D-glucose and β-D-glucose will result given enough time (see Figure 4). At room temperature, mutarotation reaches equilibrium in several hours resulting in a mixture of 36% α-D-glucose and 64% β-D-glucose.
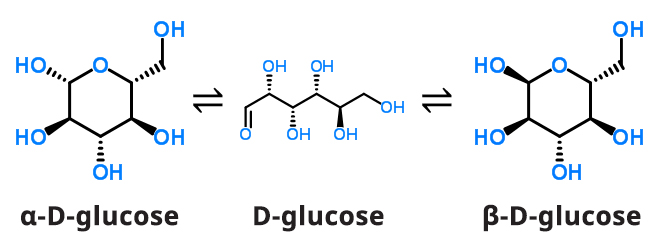
Figure 4. Mutarotation Equilibrium Reaction of D-glucose
It is important to account for glucose mutarotation when using freshly-prepared solutions of glucose. After preparation, solutions must be equilibrated at room temperature for at least twelve hours before use; otherwise, the ratio of β-D-glucose and α-D-glucose will be unpredictable and contribute to erroneous measurements.
Perles, C. E.; Volpe, P. L. O. A Simple Laboratory Experiment To Determine the Kinetics of Mutarotation of D-Glucose Using a Blood Glucose Meter. J. Chem. Educ., 2008, 85(5), 686.
3.4Glucose Oxidase
Glucose oxidase (GOx) is an enzyme that selectively catalyzes the oxidation of β-D-glucose to β-D-gluconolactone (GNL) with hydrogen peroxide as a byproduct. GOx is a highly selective enzyme. Even in the presence of nearly identical α-D-glucose, only β-D-glucose is a substrate for GOx. Enzyme-substrate interactions act like a lock and key. β-D-glucose is like the key while GOx is like the lock as depicted in the illustration in Figure 1.
Overall, the general reaction of interest shows a 1:1 molar relationship between β-D-glucose and hydrogen peroxide, as shown in Equation 1:
 |
(1) |
The bioanalytical assay described here indirectly quantifies glucose by measuring the molar concentration of H2O2. H2O2 is an electrochemically-active chemical species and can be monitored using electrochemical techniques such as chronoamperometry.
3.5Enzyme Kinetics
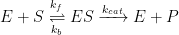
The Michaelis-Menten model of enzyme kinetics is perhaps the most straightforward and well-known model used in biochemistry. The model is based on a general kinetic approach for the steps of an enzyme reaction, as shown in Equation 2:
Nelson, D. L.; Cox, M. M. Lehninger Principles of Biochemistry, 6th ed. W.H. Freeman {&} Company, 2012.
 |
(2) |
Enzyme (E), which acts as a catalyst, combines with substrate (S) to form an enzyme-substrate complex (ES). This is a reversible equilibrium step with associated forward (kf) and reverse (kb) rate constants. The complex then catalytically reacts to produce product (P) plus enzyme at a specific rate (kcat).
From the general reaction (see Equation 2), application of typical first order kinetics shows that the overall reaction rate is equal to the rate of appearance of product. The work of Michaelis and Menten is most recognizable by the reaction rate model shown in Equation 3:
![\displaystyle{\bar{\upsilon}=\frac{d[P]}{dt}=\frac{V_m[S]}{K_m+[S]}}](https://s0.wp.com/latex.php?latex=%5Cdisplaystyle%7B%5Cbar%7B%5Cupsilon%7D%3D%5Cfrac%7Bd%5BP%5D%7D%7Bdt%7D%3D%5Cfrac%7BV_m%5BS%5D%7D%7BK_m%2B%5BS%5D%7D%7D&bg=ffffff&fg=000&s=0&c=20201002) |
(3) |
where  is the reaction rate, [P] is the concentration of enzyme product,
  is time, [S] is the substrate concentration, Vm is the maximum rate at saturating concentration of substrate, and Km is the Michaelis constant, which is equivalent to [S] when at a rate equal to 1/2Vm. The reaction rate increases with increasing substrate concentration, asymptotically approaching its maximum rate when all enzyme is bound to substrate.
is the reaction rate, [P] is the concentration of enzyme product, is time, [S] is the substrate concentration, Vm is the maximum rate at saturating concentration of substrate, and Km is the Michaelis constant, which is equivalent to [S] when at a rate equal to 1/2Vm. The reaction rate increases with increasing substrate concentration, asymptotically approaching its maximum rate when all enzyme is bound to substrate.The maximum kinetic rate achieved by the system at maximum (saturating) substrate concentrations is called Vm. The Michaelis constant (Km) is the substrate concentration at which the reaction rate is at half-maximum. Km is inversely related to the affinity of the substrate for the enzyme. The value of the Michaelis constant is dependent on enzyme, substrate, and environmental conditions such as temperature and pH.
Nelson, D. L.; Cox, M. M. Lehninger Principles of Biochemistry, 6th ed. W.H. Freeman {&} Company, 2012.
The discussion on enzyme kinetics presented above is brief. It is important to be aware that the reactions of interest in this laboratory are not simple reactions driven only by thermodynamic control.
4Electrochemical Background
Enzyme-mediated quantification of glucose by chronoamperometry
Chronoamperometry (CA)
requires a basic knowledge of the theory and instrumentation involved. A wealth of knowledge exists for both topics. Here, only a brief overview, sufficient to understand the methods employed, is given.
4.1Chronoamperometry
This lab will use an electrochemical experiment called chronoamperometry.
Chronoamperometry (CA)
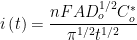
As the name implies, current is measured as a function of time while the cell potential is held constant. Current at a given time, i(t) (measured in units of amperes), is directly proportional to concentration, as shown by the Cottrell Equation:
 |
(4) |
where n is the number of electrons transferred, F is Faraday’s constant (96485 C/mol), A is the working electrode area (in cm), Do is the diffusion coefficient (in cm2/s), Co is the concentration (in mol/cm3), and is time (in s).
is time (in s).In general, the working electrode is first held at a constant potential, where no reaction occurs and thus, no charge (current) passes. Then, the cell potential is rapidly changed (stepped) to a value that induces faradaic current.
 Faradaic Current
Non-Faradaic Current The current corresponds to electrons gained or lost during electrolysis (oxidation or reduction).
Oxidation
Reduction The value of potential at which the electrolysis occurs is specific to the chemical system under study. For each mole of β-D-glucose in a sample, oxidation of the GOx enzyme produces one mole of gluconolactone and one mole of H2O2.
Non-Faradaic Current The current corresponds to electrons gained or lost during electrolysis (oxidation or reduction).
Reduction The value of potential at which the electrolysis occurs is specific to the chemical system under study. For each mole of β-D-glucose in a sample, oxidation of the GOx enzyme produces one mole of gluconolactone and one mole of H2O2.
Electrochemically, the H2O2 can undergo a two electron oxidation to form O2 and H+ (see Equation 5). H2O2 can be detected at a platinum electrode via oxidation to O2. Therefore, after the GOx has catalyzed the conversion of β-D-glucose, the H2O2 produced will be electrochemically oxidized. The extent of oxidation (magnitude of current) will be measured by chronoamperometry and compared against a calibration of several standard solutions to determine the unknown concentration of β-D-glucose in the sample.
 |
(5) |
As evident from the electrochemical half-reaction (see Equation 5), H2O2 is oxidized to O2 between 600 to 700 mV vs. an Ag/AgCl reference electrode.
 Single Junction Silver Chloride Reference Electrode
To oxidize hydrogen peroxide produced by the action of glucose oxidase, the cell potential is stepped from an initial resting potential (where neither reaction occurs nor electrons flow) to a potential more positive than 600 to 700 mV. At 900 mV, any H2O2 near the electrode surface will be oxidized. For each mole of H2O2 oxidized, two electrons will flow into the external circuit (measured as current in the potentiostat). After a specified amount of time, current is measured and verified against a calibration curve to determine the concentration of β-D-glucose in the sample. β-D-glucose is converted to gluconolactone and peroxide by glucose oxidase (see Figure 5). The peroxide generated is oxidized at the platinum electrode (slant lines). Current is monitored and related to calibration.
Single Junction Silver Chloride Reference Electrode
To oxidize hydrogen peroxide produced by the action of glucose oxidase, the cell potential is stepped from an initial resting potential (where neither reaction occurs nor electrons flow) to a potential more positive than 600 to 700 mV. At 900 mV, any H2O2 near the electrode surface will be oxidized. For each mole of H2O2 oxidized, two electrons will flow into the external circuit (measured as current in the potentiostat). After a specified amount of time, current is measured and verified against a calibration curve to determine the concentration of β-D-glucose in the sample. β-D-glucose is converted to gluconolactone and peroxide by glucose oxidase (see Figure 5). The peroxide generated is oxidized at the platinum electrode (slant lines). Current is monitored and related to calibration.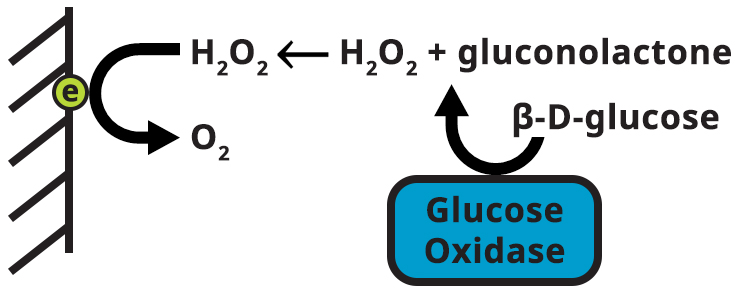
Figure 5. Electrode Reaction for Glucose Detection
4.2Electrochemical-to-Biochemical Data Translation
In this experiment, you measure the rate of enzymatic reaction through electrochemical oxidation of the enzymatic byproduct, which is an indirect measure of enzyme turnover. Thus, you must translate the electrochemical rate (current vs. time) to reaction rate (concentration vs. time). Algebraically rearranging the Cottrell equation (see Equation 4) provides a fairly simple path by which to accomplish this in a spreadsheet, as shown in Equation 6:
 |
(6) |
4.3Electrochemical Instrumentation
There are two main components of the electrochemical instrumentation used in this experiment: the potentiostat and the electrodes.
- WaveNow USB Potentiostat
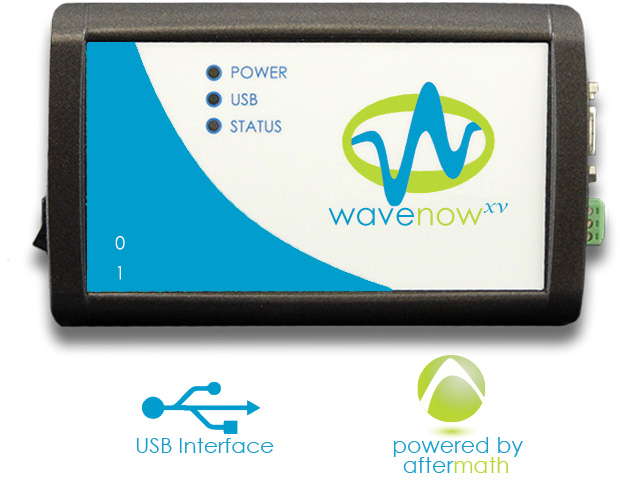 WaveNowXV Potentiostat Bundles
with AfterMath Data Organizer Software
AfterMath Downloads
WaveNowXV Potentiostat Bundles
with AfterMath Data Organizer Software
AfterMath Downloads
- Compact Voltammetry Cell
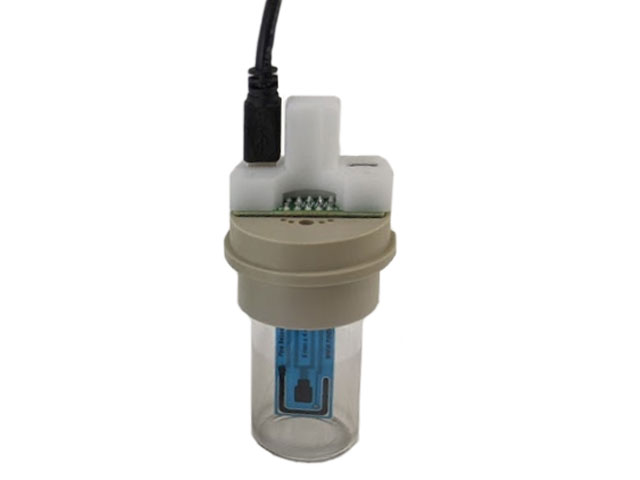 Screen-Printed Electrode Cell Starter Kit
- Screen-printed Platinum Electrodes
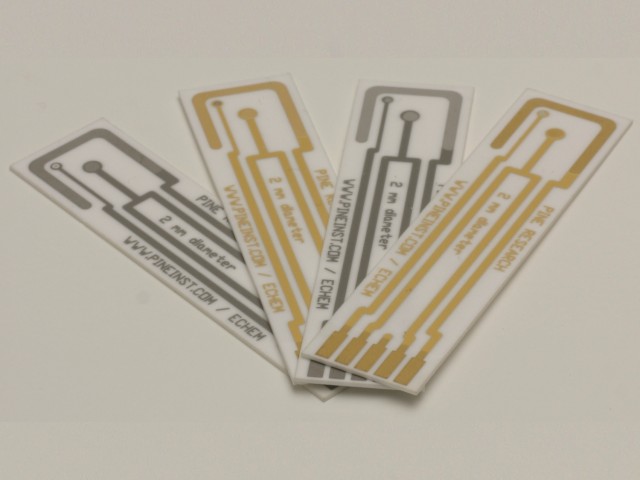 Ceramic Screen-Printed Electrodes
4.3.1Electrodes
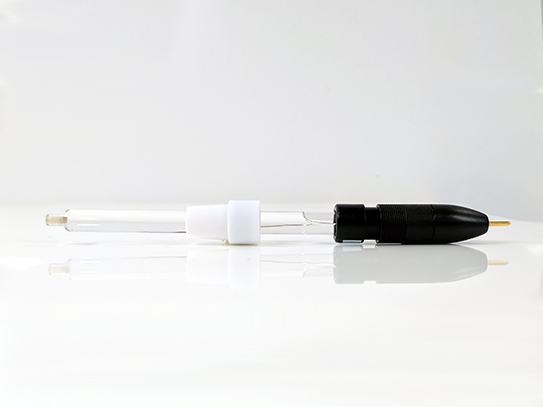
Electrodes used in this experiment are called the working, counter, and reference electrodes. The electrochemical reaction of interest occurs at the working electrode. The working electrode is a material that is a sink for electron transfer. The reference electrode has its own fixed redox potential and serves as a standard reference for cell potential. Current should not pass through a reference electrode; thus, the counter electrode (or auxiliary electrode) is the third electrode in the system. Current passes through the counter electrode to balance a change in cell potential due to the reaction at the working electrode.
For this experiment, the platinum screen-printed electrode conveniently contains all three electrodes (see Figure 6).
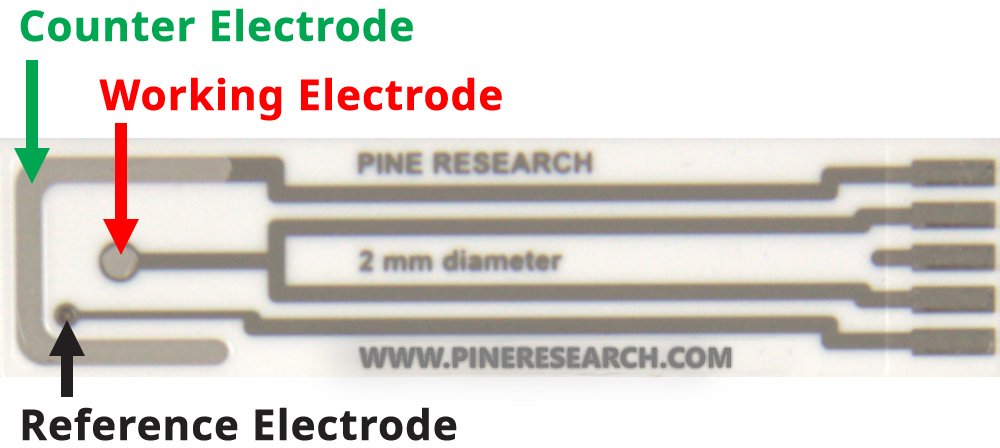
Figure 6. Pine Research Platinum Screen-Printed Electrode
5Chemicals
For all solutions, consult with your instructor. Some may have been prepared in advance. For other solutions, they may be prepared from a higher concentration stock solution that has been provided. The volumes listed are for one student or one group of students working together. The water used for these solutions should be distilled and deionized. Such water typically has a resistivity of 18 MΩ cm.
5.1Sodium Acetate Buffer (1.0 M)
Sodium acetate is abbreviated NaOAc. Calculate the appropriate mass of NaOAc to prepare 100 mL of a 1.0 M solution. Add this mass to a 100 mL volumetric flask and add about 70 mL distilled water. Then, add 4.2 mL concentrated hydrochloric acid (36.5% - 38% v/v). Swirl to completely dissolve, then dilute to the mark with distilled water. Label this solution as 1.0 M NaOAc Buffer.
5.2Sodium Acetate Buffer (50 mM)
Prepare 500 mL of a 50 mM NaOAc buffer by diluting the 1.0 M NaOAc buffer previously prepared (HINT: M1V1 = M2V2). Label this solution as 50 mM NaOAc Buffer.
5.3Glucose Oxidase Solution (100 IU/mL)
Dissolve 50 kU (fifty thousand IU) of glucose oxidase in 500 mL of the previously-prepared 50 mM NaOAc Buffer. Stir gently with a glass rod to avoid creating bubbles. Keep refrigerated for storage and warm to room temperature before use. Label this solution as 100 IU/mL Glucose Oxidase Stock.
5.4Glucose Stock Solution (100 mM)
Calculate the appropriate mass of D-(+)-glucose (molecular weight = 180.16 g/mol) to prepare 100 mL of a 100 mM solution. Add this mass to a 100 mL volumetric flask and add about 75 mL of the 50 mM NaOAc Buffer and swirl to dissolve completely. Then, dilute to the mark and label as 100 mM Glucose Stock Solution.
5.5Beverage Sample Stock Solution
Prepare a stock beverage sample. Select any glucose-containing beverage. Beverage selection may affect results. Some sweetened beverages contain little glucose despite having a high content of “sugars” listed on the nutritional label. Record the nutritional label data and ingredients list for each beverage sample into a notebook.
If the beverage is carbonated, decarbonate it prior to use (i.e., remove all gas bubbles). This is accomplished by placing the soft drink in a plastic bottle and sealing the cap, shaking for 20-25 seconds, and then slowly opening the cap to release CO2. Repeat this procedure until no observable carbonation is present.
Mix 0.8 mL pure beverage with 0.5 mL 1.0 M NaOAc Buffer and 8.7 mL water. Label this solution as Beverage Stock Solution.
5.6Beverage Sample Test Solution
Test beverage samples should be analyzed immediately after preparation. The preparation for the beverage solution tested will be given in the experimental section. Record nutritional information label content and any sugars listed in the ingredients label for any beverage tested.
5.7Glucose Calibration Standards
Prepare a series of at least five glucose standards. Make these standards from the previously-prepared 100 mM Glucose Stock Solution and 50 mM NaOAc Buffer (see Table 1). It will be easiest to prepare each sample in separate 20 mL disposable vials (e.g., scintillation vials,
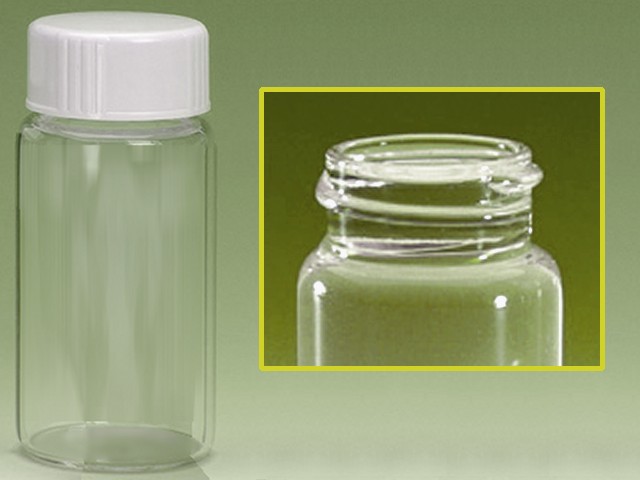 Disposable 20 mL Glass Vial
which fit the compact voltammetry cell cap). Properly label each standard prepared.
Disposable 20 mL Glass Vial
which fit the compact voltammetry cell cap). Properly label each standard prepared.
Disposable 20 mL Glass Vial
which fit the compact voltammetry cell cap). Properly label each standard prepared.| Standard # | [Glucose] (mM) |
100 mM Glucose Stock (mL) |
50 mM NaOAc Buffer (mL) |
| 1 | 0 | 0.0 | 5.0 |
| 2 | 5 | 0.5 | 4.5 |
| 3 | 10 | 1.0 | 4.0 |
| 4 | 15 | 1.5 | 3.5 |
| 5 | 20 | 2.0 | 3.0 |
Table 1. Glucose Standard Preparations
6Experimental
In this lab, the concentration of glucose in a beverage sample will be obtained by oxidizing an enzymatic byproduct of glucose oxidase, hydrogen peroxide. After you have made the solutions, proceed to the instrumental setup. The analysis portion involves construction of a calibration curve from glucose standards and the analysis of a beverage sample as compared to the calibration. Read through the experimental section completely before proceeding.
6.1Setup
The following instrumentation supplies will be needed to perform this experiment: the Pine Research WaveNow potentiostat
WaveNowXV Potentiostat Bundles
and USB cable, platinum screen-printed electrode,
Ceramic Screen-Printed Electrodes
compact voltammetry cell,
Screen-Printed Electrode Cell Starter Kit
and the previously-prepared solutions. A stopwatch must also be used to accurately ensure all samples have reacted with enzyme for the same duration of time.
WaveNowXV Potentiostat Bundles
and USB cable, platinum screen-printed electrode,
Ceramic Screen-Printed Electrodes
compact voltammetry cell,
Screen-Printed Electrode Cell Starter Kit
and the previously-prepared solutions. A stopwatch must also be used to accurately ensure all samples have reacted with enzyme for the same duration of time.- Turn on the potentiostat and connect it to a personal computer using the USB cable. Use the AfterMath software application to control the potentiostat.
- Connect the cell cable to the potentiostat using the end terminating with an HD-15 connector. The other end of the cable will be a mini-USB-style connector.
- Obtain one platinum screen-printed electrode. This electrode has a working electrode in the center that has a 2.0 mm diameter (see Figure 6). Compute the surface area of the working electrode (in cm2) and record the result.
- From the Experiments menu in AfterMath, select “Chronoamperometry (CA)…” Notice, this will create a new Experiment Node in the archive structure on the left panel of the screen (see Figure 7).
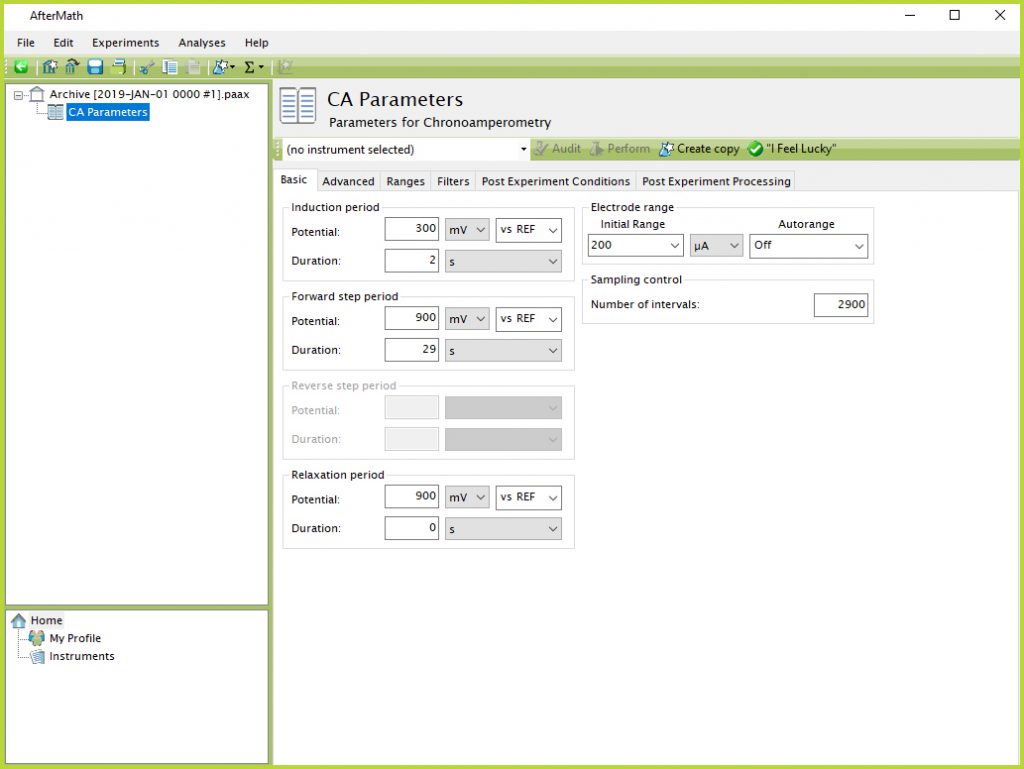
Figure 7. Chronoamperometry Experimental Parameters in AfterMath Software
- Select the appropriate potentiostat from the drop-down menu at the top of the parameter entry screen (e.g., Pine WaveNow).
- Perform a CA experiment consisting of the following parameters: 300 mV induction period potential for 2 s; 900 mV forward step potential for 29 s; 900 mV relaxation period potential for 0 s; initial current range = 200 µA with Autorange Off; and 2900 intervals (see Figure 7).
6.2Glucose Calibration
The enzyme-glucose reaction is kinetically-limited; therefore, it is important to prepare and analyze each standard before moving on to another. Work systematically and in sequence, from lowest to highest concentration of glucose. Analyze each of at least five standard glucose samples, given in Table 1, in the following manner:
- Rinse the electrode with deionized water and dab dry with a delicate wipe. Set aside.
- Obtain a standard sample (5 mL of solution in a 20 mL threaded vial).
- Add the 5 mL Glucose Oxidase Solution to the test solution. Shake well, and immediately start a timer.
- Allow the enzyme to react for 5 minutes.
- After 5 minutes, insert the platinum screen-printed electrode into the hand grip (see Figure 8).
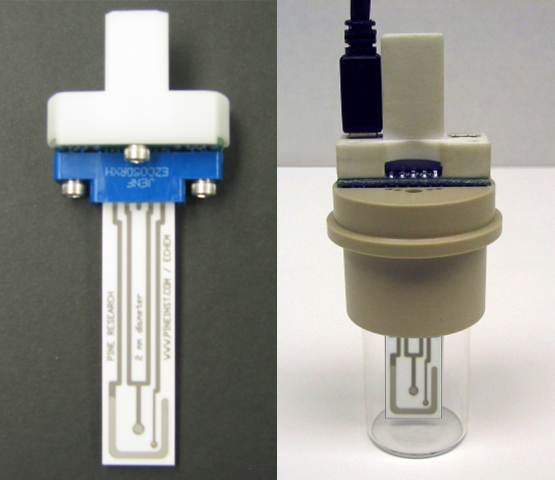
Figure 8. Assembly of the Compact Voltammetry Cell
- Insert the hand grip, which is connected to the electrode, into the cap (see Figure 8).
- Connect the USB-style cell cable to the grip. The correct connector is to the LEFT of the electrode face of the screen-printed electrode card when facing downward (see Figure 8, right photo).
- In AfterMath, highlight the CA Parameters icon in the tree structure on the left (that you created above). Click the “Perform” button to begin the chronoamperometry experiment.
- After the experiment completes, right click the experiment node in the left panel of AfterMath (e.g., CA Experiment (00##)) and rename it to indicate the glucose concentration used.
- Remove the grip and cap from the vial. Dispose of the waste appropriately. Repeat these steps for each calibration standard until you have obtained data for all five standards.
6.3Beverage Analysis
To a clean 20 mL threaded vial, add 5 mL Beverage Sample Stock Solution and 5 mL of the Glucose Oxidase Stock. Mix well, and start a timer.
Allow the enzyme to react for 5 minutes. Perform chronoamperometry on the sample as with the glucose calibration. The measurement can be made in triplicate for statistical validation of the data.
7Data Analysis
The resultant data from a chronoamperometry experiment, called a chronoamperogram, is a plot of current vs. time. The current arises from the electrochemical oxidation of H2O2 (see Equation 5 and Figure 5). From Equation 5, the measured current is proportional to the concentration of peroxide. From the overall enzyme reaction, one mole of glucose is oxidized for every mole of peroxide produced and subsequently electrochemically oxidized.
To maintain assumptions for the Michaelis-Menten model of enzyme kinetics (discussed in most biochemistry textbooks),
Nelson, D. L.; Cox, M. M. Lehninger Principles of Biochemistry, 6th ed. W.H. Freeman {&} Company, 2012.
a common enzyme assay is to vary substrate concentration and measure the reaction rate. In this lab, current is a direct measure of the kinetic rate (the chronoamperogram gives current as a function of time for the oxidation of hydrogen peroxide, which is in molar equivalency with substrate).
7.1Determine Cottrell Current at 8 s
In addition to recording data in your notebook, open a spreadsheet and create an organized system to analyze data.
For each glucose standard, review the corresponding chronoamperogram in AfterMath.
- Expand the appropriate experiment node and select the “Current” node.
- In the graphical data window in the right panel of AfterMath, right-click on the data trace. From the menu, select Add tool and then Crosshair.
- A large plus sign will lock to the data trace. The crosshair tool will report the x and y values for a certain point on the data, in this case expressed as time (x-intercept) and current (y-intercept). With the mouse, move the crosshair to the data point at a time of 8 seconds. You may have to use the plot tools (such as zoom in) to more easily select exactly 8 seconds (see Figure 9).
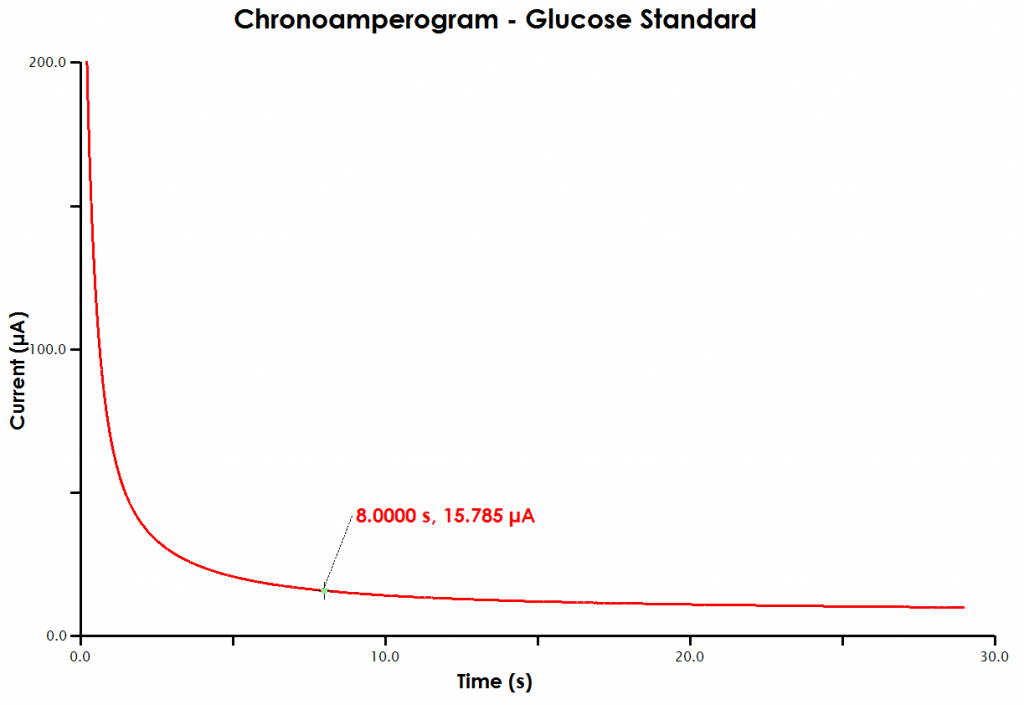
Figure 9. Determination of Cottrell Current at 8 s in AfterMath
- Record the current at 8 seconds.
- Repeat this process for each glucose standard.
- In the spreadsheet, enter concentration in one column and current at 8 seconds in the next.
7.2Data Transformation
As described previously (see Section 4.2), convert current to reaction rate (see Equation 6). HINT: current is in amperes in the Cottrell Equation, and  is a concentration in units of mol/cm3. Use formulas in your spreadsheet to avoid simple mathematics errors.
is a concentration in units of mol/cm3. Use formulas in your spreadsheet to avoid simple mathematics errors. 7.3Create Michaelis-Menten Plot
Create a plot of reaction rate (y axis) vs. glucose concentration (x axis). Plot the data as a series of points without a line connecting the points (see Figure 10).
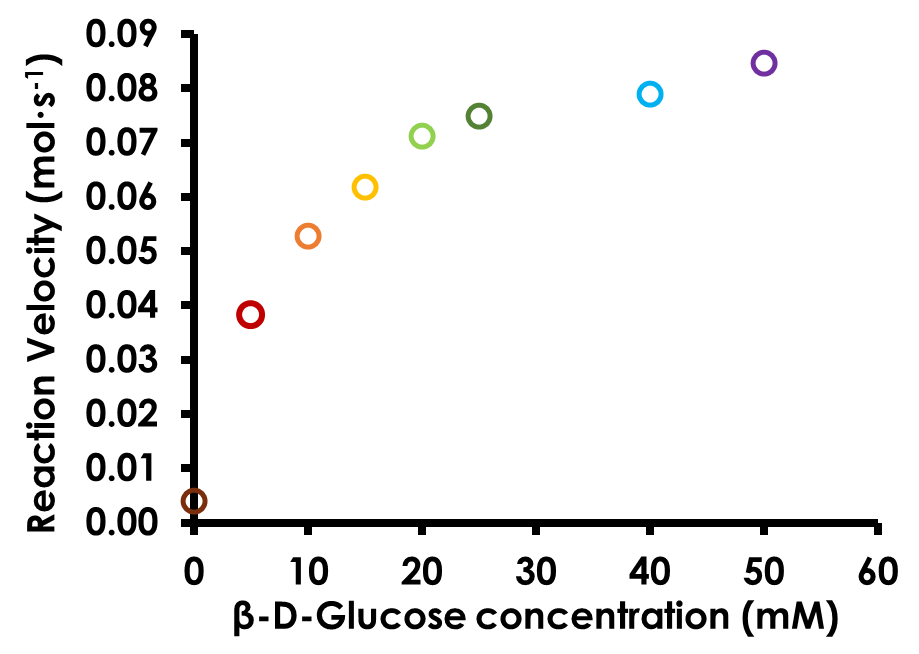
Figure 10. Michaelis-Menten Plot for Glucose Oxidase
As discussed in the Biochemistry Background, the data in the calibration plot should not be linear across the range tested. Lack of linearity is due to the two limiting factors of the glucose oxidase enzyme system: 1) the amount of substrate (β-D-glucose) available; and 2) the maximum turnover rate of the glucose oxidase enzyme.
7.4Create Lineweaver-Burk Plot
Transform the data used in the previous plot to the Lineweaver-Burk (double reciprocal) form. Plot 1/ on the y axis and 1/[S] on the x axis. The data should now appear linear. Perform a linear regression analysis and display the equation of the best-fit line (see Figure 11). Note the slope and intercept and consider their proper units.
on the y axis and 1/[S] on the x axis. The data should now appear linear. Perform a linear regression analysis and display the equation of the best-fit line (see Figure 11). Note the slope and intercept and consider their proper units.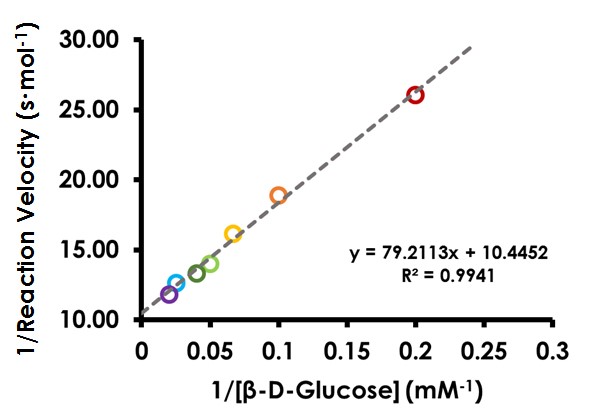
Figure 11. Lineweaver-Burk (Double Reciprocal) Plot for Glucose Oxidase
7.5Determine β-D-Glucose Concentration from Analysis in Beverage
Determine the peroxide current for each beverage tested, as discussed previously (see Sections 7.1 and 7.2). Determine β-D-glucose concentration in each beverage by using the calibration curve in linear format. Report the concentration (HINT: account for all dilutions).
7.6Determine Kinetic Parameters
From the slope and intercept of the linear regression performed on the double reciprocal plot, determine Vm and Km and record these values (HINT: solve as a system of two equations with two unknowns).
![\displaystyle{\frac{1}{\bar{\upsilon}}=\frac{K_m}{V_m[S]}+\frac{1}{V_m}}](https://s0.wp.com/latex.php?latex=%5Cdisplaystyle%7B%5Cfrac%7B1%7D%7B%5Cbar%7B%5Cupsilon%7D%7D%3D%5Cfrac%7BK_m%7D%7BV_m%5BS%5D%7D%2B%5Cfrac%7B1%7D%7BV_m%7D%7D&bg=ffffff&fg=000&s=0&c=20201002) |
(7) |
8Report Questions
- Compare glucose concentration as determined by this method to the nutritional label on the beverage. Do the values agree? Why or why not? Are there clues in the ingredient list that support your observations?
- If a current measurement by chronoamperometry was taken immediately after glucose oxidase was added to the sample, how would that affect the concentration measured by chronoamperometry?
- Why are all solutions in this lab in a buffered NaOAc solution? (HINT: consider general properties of enzymes)
- How should current vary with peroxide oxidation?
- This experiment used a 2 mm disk electrode. If a working electrode with a 5 mm disk was used instead for the glucose calibration, discuss the change expected in current response. What is the proportionality between electrode area and current?
- State the values of Vm and Km, with the appropriate units. Show the calculation of Vm and Km from the linear calibration data.
9References
- U.S. Government. Title 21 – Food and Drugs. https://www.govinfo.gov/content/pkg/CFR-2008-title21-vol2/pdf/CFR-2008-title21-vol2-part101-subpartA.pdf.
- Ventura, E. E.; Davis, J. N.; Goran, M. I. Sugar Content of Popular Sweetened Beverages Based on Objective Laboratory Analysis: Focus on Fructose Content. Obesity, 2011, 19(4), 868–874.
- Hanover, L. M.; White, J. S. Manufacturing, composition, and applications of fructose. The American Journal of Clinical Nutrition, 1993, 58(5 Suppl), 724S-732S.
- Nelson, D. L.; Cox, M. M. Lehninger Principles of Biochemistry, 6th ed. W.H. Freeman {&} Company, 2012.
- Perles, C. E.; Volpe, P. L. O. A Simple Laboratory Experiment To Determine the Kinetics of Mutarotation of D-Glucose Using a Blood Glucose Meter. J. Chem. Educ., 2008, 85(5), 686.