


Electrochemical Analysis of Acetaminophen in Pain Relief Medication
Last Updated: 11/1/19 by Alex Peroff
Download as PDF1Abstract
This experiment demonstrates the use of modern electroanalytical chemistry to determine the active ingredient in a popular children’s pain relief medication.
 Van Benschoten, J. J. ; Lewis, J. Y. ; Heineman, W. R. ; Roston, D. A. ; Kissinger, P. T. Cyclic Voltammetry Experiment. J. Chem. Educ., 1983, 60(9), 772.
Potter, D. W.; Miller, D. W.; Hinson, J. A. Identification of Acetaminophen Polymerization Products Catalyzed by Horseradish Peroxidase. J. Biol. Chem., 1985, 260(22), 12174-12180. Designed for use in an instructional laboratory setting, this procedure describes the use of cyclic voltammetry to verify the concentration of acetaminophen (4-acetamidophenol) indicated on the suspension label. Advantages of the approach used here include the use of inexpensive and disposable screen-printed carbon electrodes and the use of an inexpensive consumer-grade supporting electrolyte solution that is widely available on the mass market. The only reagent grade chemical required for this procedure is a small amount of pure 4-acetamidophenol.
Potter, D. W.; Miller, D. W.; Hinson, J. A. Identification of Acetaminophen Polymerization Products Catalyzed by Horseradish Peroxidase. J. Biol. Chem., 1985, 260(22), 12174-12180. Designed for use in an instructional laboratory setting, this procedure describes the use of cyclic voltammetry to verify the concentration of acetaminophen (4-acetamidophenol) indicated on the suspension label. Advantages of the approach used here include the use of inexpensive and disposable screen-printed carbon electrodes and the use of an inexpensive consumer-grade supporting electrolyte solution that is widely available on the mass market. The only reagent grade chemical required for this procedure is a small amount of pure 4-acetamidophenol.
2Introduction
Acetaminophen is an active ingredient in several over-the-counter pain relief medications, including the well-known brand, Tylenol®. Acetaminophen has largely replaced aspirin (acetylsalicylic acid) as the medication of choice for children and infants because aspirin has, in some cases, been linked to the development of Reye’s Syndrome.
For easier delivery to young children, acetaminophen is often formulated as an oral suspension, which is a viscous aqueous suspension containing various colorings and flavorings (see Figure 1). A typical sample of the suspension has an acetaminophen concentration in the range from 30 to 100 g/L. In this lab experiment, an electrochemical method known as cyclic voltammetry (CV)
 Cyclic Voltammetry (CV)
is used to determine the acetaminophen concentration in a sample of the medication, and the result is compared with the stated value provided by the manufacturer on the medication package.
Cyclic Voltammetry (CV)
is used to determine the acetaminophen concentration in a sample of the medication, and the result is compared with the stated value provided by the manufacturer on the medication package.
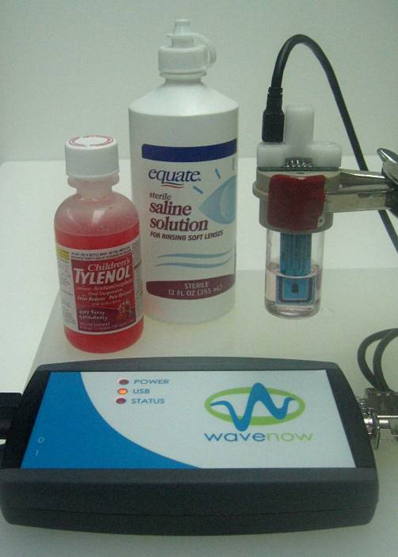
Figure 1. Experimental Apparatus and Chemicals
3Background
Acetaminophen, with a formal chemical name of 4-acetamidophenol, is an electroactive molecule that can be oxidized. Acetaminophen (A) can be oxidized to the quinone form (B), called N-acetyl-4-quinoneimine (abbreviated as NAPQI) in a two-electron, two-proton electron transfer process where, in the presence of an acid catalyst, NAPQI (B) is rapidly converted to a hydrate (C) called N-acetyl-4-quinoneimine hydrate (see Figure 2). The two-electron oxidation of acetaminophen (A) is observed as an anodic (oxidizing) current when the electrode potential is swept in the positive direction.
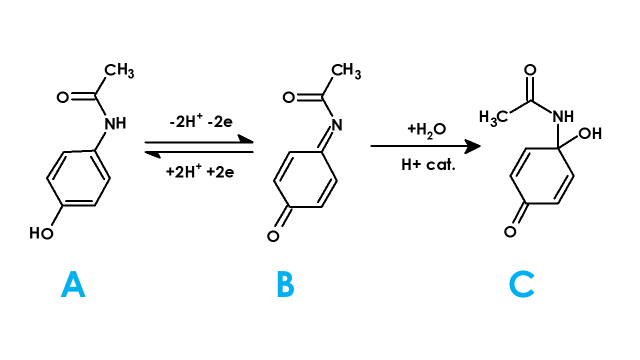
Figure 2. Electrochemical Reaction of Acetaminophen
In an acidic solution (pH~2), the NAPQI product (B) is quickly converted to the hydrate (C). Because the hydrate is electrochemically-inactive, it is not possible to convert the hydrate back to acetaminophen via reduction. That is, it is not possible to reverse the process by sweeping the electrode potential back in the negative direction. In an electrochemical context, this type of reaction is said to be irreversible.
At higher pH, however, the NAPQI (B) intermediate is not as rapidly converted to the hydrate. Unlike the hydrate (C), the NAPQI intermediate (B) is, in fact, electroactive. This means that the NAPQI (B) can be converted back to acetaminophen (A) in a two-electron, two-proton reduction process at the electrode (see Figure 2). This reversal is accomplished by sweeping the electrode potential back to negative potentials at which the NAPQI (B) is reduced to acetaminophen (A).
With less acid catalyst present at higher pH, the rate of hydration decreases, resulting in a higher percentage of NAPQI (B) molecules remaining intact and in the vicinity of the electrode surface. Thus, as the solution pH increases, it becomes possible to observe a cathodic (reducing) current at the electrode, and the electrochemical process changes from being irreversible to being quasi-reversible.
In this experiment, cyclic voltammetry (CV)
Cyclic Voltammetry (CV)
is used to observe both the anodic (oxidizing) current and the cathodic (reducing) current as the potential of the electrode is swept first in the positive direction and then back in the negative direction (see Figure 3). Because of its dependence upon the pH of the solution, the cathodic current is not a good choice for quantitative analysis. The anodic peak current, however, can be used as an analytical signal that is proportional to the concentration of the acetaminophen (A) in the solution.
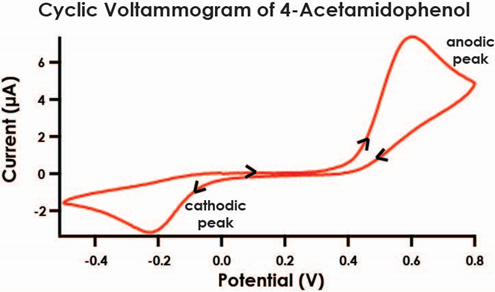
Figure 3. Quasi-Reversible Electrochemical Process of 4-Acetamidophenol
As is typical in most analytical assays, a set of standard solutions of the analyte (acetaminophen) are prepared and analyzed, and then a calibration curve is constructed to show the relationship between the signal (i.e., the anodic current) and the analyte concentration. After establishing this relationship, a dilute solution of the children’s pain relief medication is prepared and analyzed, and the analyte concentration in the suspension is determined.
4Experimental
4.1Instrumentation
The following instrumentation, available from Pine Research, are required:
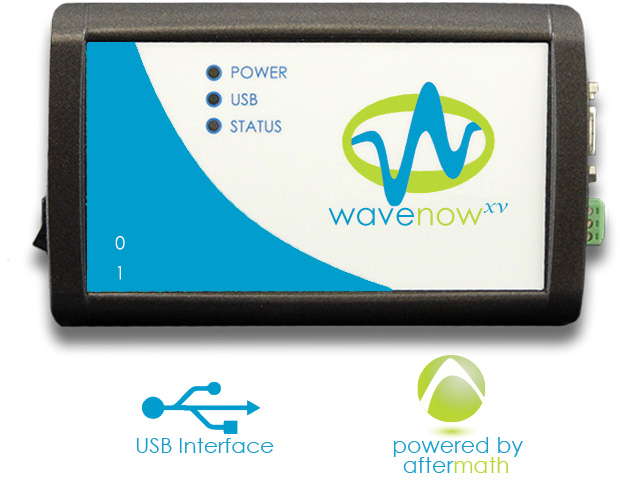
- WaveNow Potentiostat/Galvanostat System
 WaveNowXV Potentiostat Bundles
connected to a PC with AfterMath Data Organizer installed
AfterMath Downloads
WaveNowXV Potentiostat Bundles
connected to a PC with AfterMath Data Organizer installed
AfterMath Downloads
- Compact Voltammetry Cell (Pine Research part number AKSPEKIT)
 Screen-Printed Electrode Cell Starter Kit
- Screen-Printed Carbon Electrodes with Spacers (Pine Research part number RRPE1001C-100)
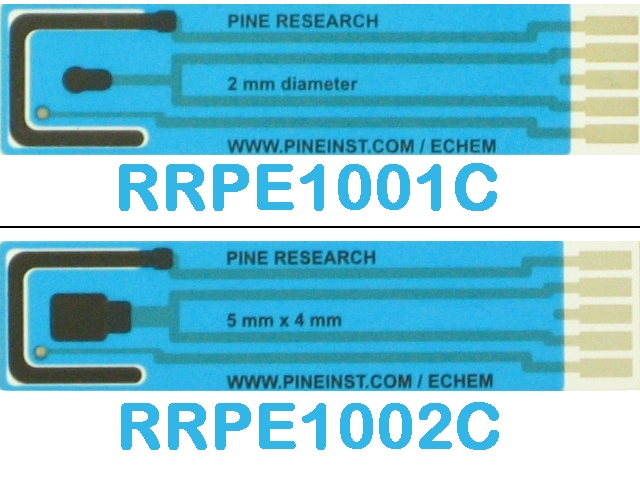 Carbon Screen-Printed Electrodes
4.2Chemicals
The following chemicals or reagents are needed to prepare stock solutions:
- Contact Lens saline buffer. The major ingredients of this buffer (pH~7.3 ) are boric acid, sodium borate, and sodium or potassium chloride
- 4-Acetamidophenol CH2CONHC6H4OH (151.2 g/mol)
- Children’s Acetaminophen Medication, oral suspension
4.3Solution Preparation
Two solutions are required in this laboratory, in addition to contact lens solution (buffer) (see Sections 4.3.1 and 4.3.2). Using these stock solutions, you will prepare standard solutions and a diluted children’s medication solutions.
4.3.110.0 mM Acetaminophen Stock Solution
Prepare 50 mL of 10 mM acetaminophen stock solution by weighing the appropriate mass of 4-acetamidophenol and dissolving in 5 - 10 mL of contact lens solution in a 50 mL volumetric flask. Add more contact lens solution and dilute to the mark. Label the exact concentration and record this value.
4.3.2Children’s Acetaminophen Medication Stock Solution
You will be provided with a stock solution of children’s acetaminophen medication, whose concentration will be analytically determined later. The exact mass (three significant figures) of children’s acetaminophen medication suspension and its density will be provided to you. Record these values.
Review the label on the bottle of the children’s acetaminophen medication. It will indicate the concentration of acetaminophen in the suspension (HINT: dose of acetaminophen per volume of suspension). Record the value on the bottle and convert the concentration to units of molarity (M, or mol/L).
4.3.3Acetaminophen Calibration Standards
Calibration standards are most efficiently prepared using adjustable volumetric pipettes and using Table 1 as a guide. Note that the first solution shown in the table contains only the buffer solution. This solution is used as a blank solution to obtain a background cyclic voltammogram. The concentrations of standard solutions will have values near those listed in the table; however, it is important to calculate the actual concentrations using the precise concentration of the 10 mM acetaminophen stock solution prepared.
| Acetaminophen Stock Solution (mL) |
Buffer Solution (mL) |
Concentration (mM) |
| 0.00 | 10.0 | 0.00 |
| 0.20 | 9.80 | 0.20 |
| 0.40 | 9.60 | 0.40 |
| 0.60 | 9.40 | 0.60 |
| 0.80 | 9.20 | 0.80 |
| 1.00 | 9.00 | 1.00 |
Table 1. Guide for Preparing Standard Solutions
Each individual student (or group of students) should prepare these solutions by combining the volumes of stock and buffer solution shown in the table to arrive at of each stock solution. Prepare these solutions by pipetting the stock and buffer solutions directly into a set of clean and dry scintillation vials.
4.3.4Diluted Medication Test Solution (unknown)
The acetaminophen concentration in the children’s acetaminophen medication stock solution is too high for optimal measurements using cyclic voltammetry.
Prepare a 10 mL test solution from the children’s acetaminophen medication stock solution provided to you. The test solution prepared should be approximately a 1:10 dilution. Use a clean and dry pipette to mix the stock and contact lens solution. Do not dilute with water. Record the dilution and remember to consider this dilution step in subsequent calculations.
This solution will be analyzed by cyclic voltammetry in the same manner as the calibration standards to analytically determine the medication concentration of acetaminophen.
5Procedure
5.1Background Voltammetry
A simple background voltammogram of the saline buffer is a good way to confirm several important control characteristics, including the purity of the solution, the cleanliness of the glassware, and the cleanliness of the electrode surface, in a single experiment. Any electroactive impurities from the buffer, the glassware, or the electrode surface will cause unexplained peaks in the background voltammogram.
5.1.1Set Up the Potentiostat and Cell
- Turn on the WaveNow potentiostat and connect it to a personal computer using a USB cable. Use the AfterMath software application to control the potentiostat.
- Connect the cell cable to the potentiostat using the end terminated with an HD-15 connector. The other end of the cable should be a mini-USB connector.
- Obtain a screen-printed electrode (SPE) (see Figure 4). These patterned electrodes have a working electrode in the center which has a 2.0 mm diameter. The working electrode area is defined by a blue masking material which coats the underlying carbon ink. Compute the surface area of the working electrode (in cm2) and make a note of your result in your lab notebook.
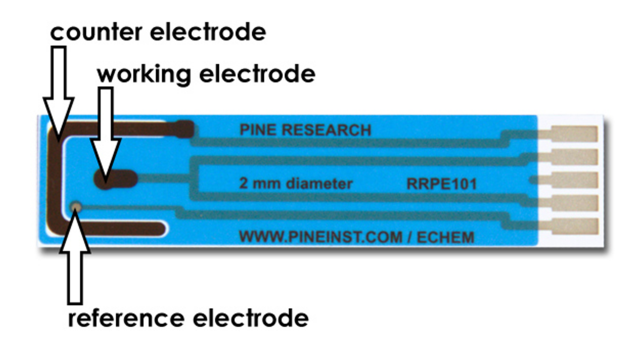
Figure 4. Working, Counter, and Reference Electrodes on a Carbon SPE
- The electrode pattern also includes a counter electrode (large, black U-shaped electrode) and a silver/silver chloride reference electrode (a small grey dot located slightly off-center).
- Fasten the compact voltammetry cell cap to the glass vial that contains the blank standard solution. Carefully mount one carbon SPE onto the hand-grip. Put one to two spacers on the back side of the SPE, and use the spacers to secure proper electrical contact between the SPE and the pins in the blue electrode connector (see Figure 5).
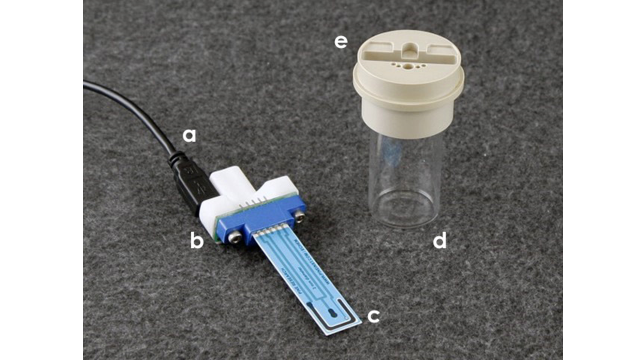
Figure 5. Compact Voltammetry Cell Components: (a) USB-Style Cell Cable; (b) Cell Grip Mount; (c) Screen-Printed Electrode (SPE); (d) Scintillation Vial; and (e) Cap
- Refer to Figure 5 for the following instructions: insert the cell grip mount (b), loaded with the SPE (c), into the cap (e),which is screwed onto the scintillation vial (d), and connect the USB-style cell cable (a) to the USB-style port on the left side of the cell grip mount.
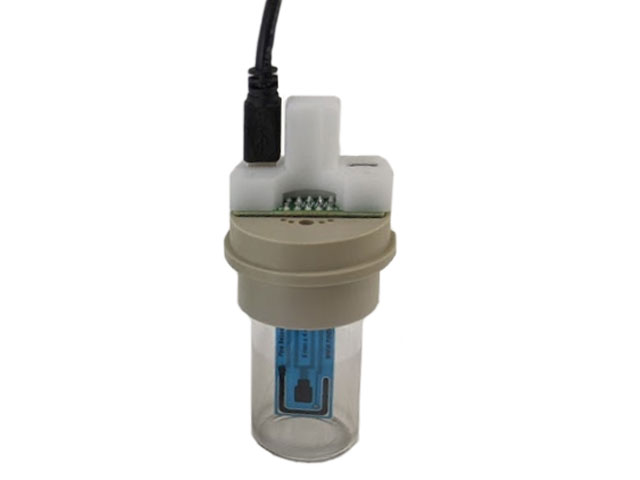
- The completely assembled cell is shown in Figure 6.
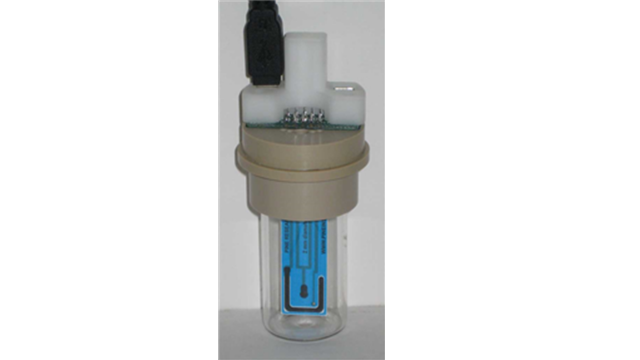
Figure 6. Assembled Compact Voltammetry Cell, with USB Cable Connected to the Left
5.1.2Performing the Background Scan with Experimental Parameters
- Place Contact Saline Buffer solution into the electrochemical cell.
- In AfterMath, select the Cyclic Voltammetry option from the Experiments menu, and then enter the experimental parameters shown in Figure 7. Note that these parameters are suggested starting values for obtaining a background voltammogram. It may be necessary to make some minor adjustments to obtain a satisfactory voltammogram. In particular, it may be necessary to adjust the current range to optimize the appearance of the voltammogram.
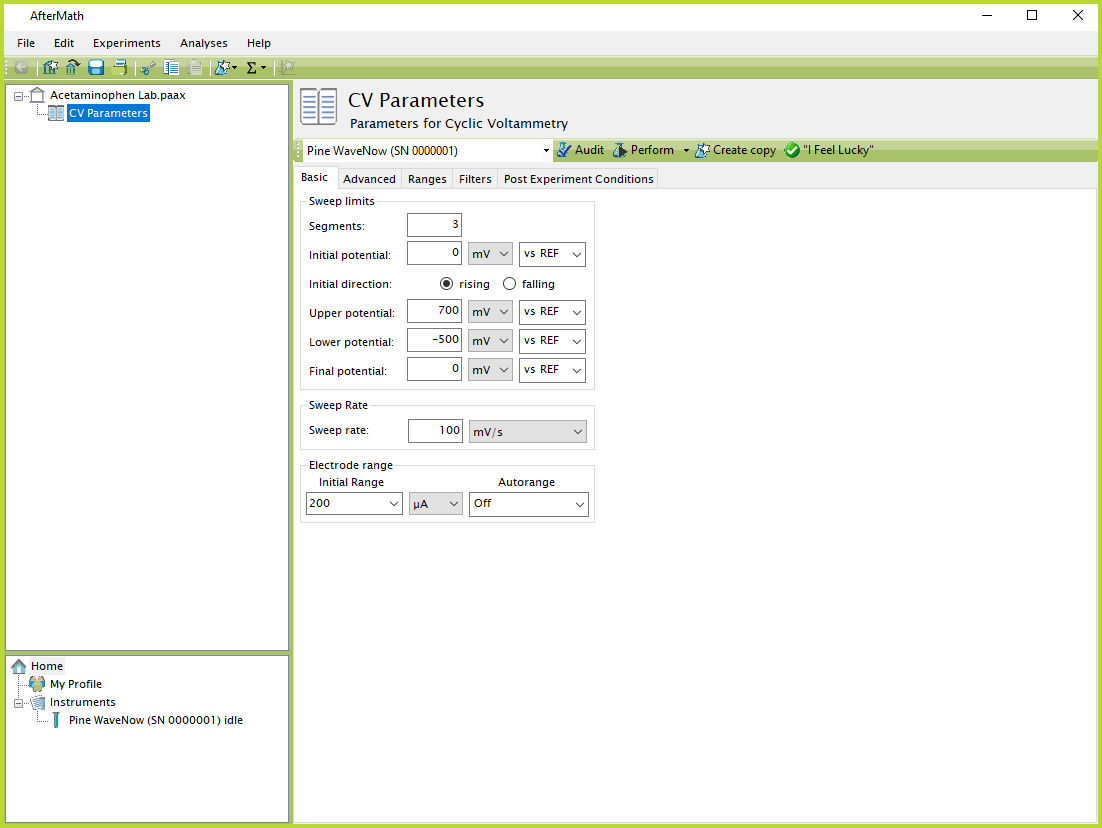
Figure 7. AfterMath CV Experimental Parameters
- Click the "Perform" button to initiate the experiment. You may wish to repeat the experiment using different current ranges until an optimum range is found. Alternately, you can use the "On" setting for current Autorange and allow the software to select the optimal range automatically.
- The background cyclic voltammogram should be relatively featureless (other than random sub-microampere noise) and exhibit no significant peaks. The overall background current should be less than 500 nA. If significant peaks are apparent, then the buffer, the glassware, and/or the electrode surface are likely contaminated. Consult with your instructor if excessive or unusual background current is observed.
- After acquiring a satisfactory background voltammogram, save the data archive to the disk so that you do not lose your data. Give the archive a filename which is meaningful to you (such as “Acetaminophen Lab”). Save the archive file to the disk frequently as you continue to acquire more results.
- After each measurement using an SPE, rinse it with saline solution, and dry it either by gently blotting with a piece of paper towel or by blowing a stream of dry nitrogen over the electrode surface.
- Note that each time you use a new SPE, you should repeat this procedure and obtain a new background cyclic voltammogram. In this way, you can verify that the surface of the SPE has not been inadvertently contaminated by mishandling or touching the surface of the electrode.
5.1.3Voltammograms of Calibration Standards
- Create a new folder in your data archive called “Standard Solutions” by right-clicking on the data archive (left hand panel), and choosing the “New > Folder” menu option. Use the mouse to drag the background voltammogram and the CV parameters into this new folder.
- As before, obtain cyclic voltammograms for each of the five remaining standard solutions that you have prepared. Set the electrode current range to 200 μA for all CV measurements, and use the same sweep rate (100 mV/s) for all solutions. When a solution in a vial is not in use, be sure to keep the vial securely capped. Each voltammogram should exhibit a prominent anodic peak near 0.5 V and a smaller cathodic peak near -0.2 V (see Figure 3).
- After each voltammogram is obtained, be sure to rename it with a name that helps you to remember the corresponding solution concentration. Move each voltammogram into the “Standard Solutions” folder that you created above.
- Obtain a cyclic voltammogram for the Diluted Medication Test Solution and save your results.
5.1.4Voltammogram of Acetaminophen Medication Solution (Unknown)
- Create a new folder in your data archive called “Unknown Solutions” by right-clicking on the data archive (left hand panel), and choosing the “New > Folder” menu option. Use the mouse to drag the background voltammogram and the CV parameters into this new folder.
- As before, obtain a cyclic voltammogram for the diluted acetaminophen medication solution. Set the electrode current range to 200 μA for all CV measurements, and use the same sweep rate (100 mV/s) for this solution. When a solution in a vial is not in use, be sure to keep the vial securely capped. The voltammogram should exhibit a prominent anodic peak near 0.5 V and a smaller cathodic peak near -0.2 V as you observed for the calibration standards (see Figure 3).
- After each the voltammogram is obtained, be sure to rename it to indicate it is the data obtained for the diluted medication of unknown concentration. Move the voltammogram into the “Unknown Solutions” folder that you created above.
6Data Analysis
6.1Peak Height Analysis
The first step in analyzing your results is to obtain the peak height data from the voltammograms. The peak height is proportional to the acetaminophen concentration, and thus will be used to construct the calibration curve.
AfterMath software provides an easy way to measure the peak height in a cyclic voltammogram by placing a special Peak Height tool on each voltammogram (see Figure 8). Measure the peak current for each of the five standard solutions. Also measure the peak current for the voltammogram obtained using the Diluted Medication Test Solution. Record all of these results in your notebook.
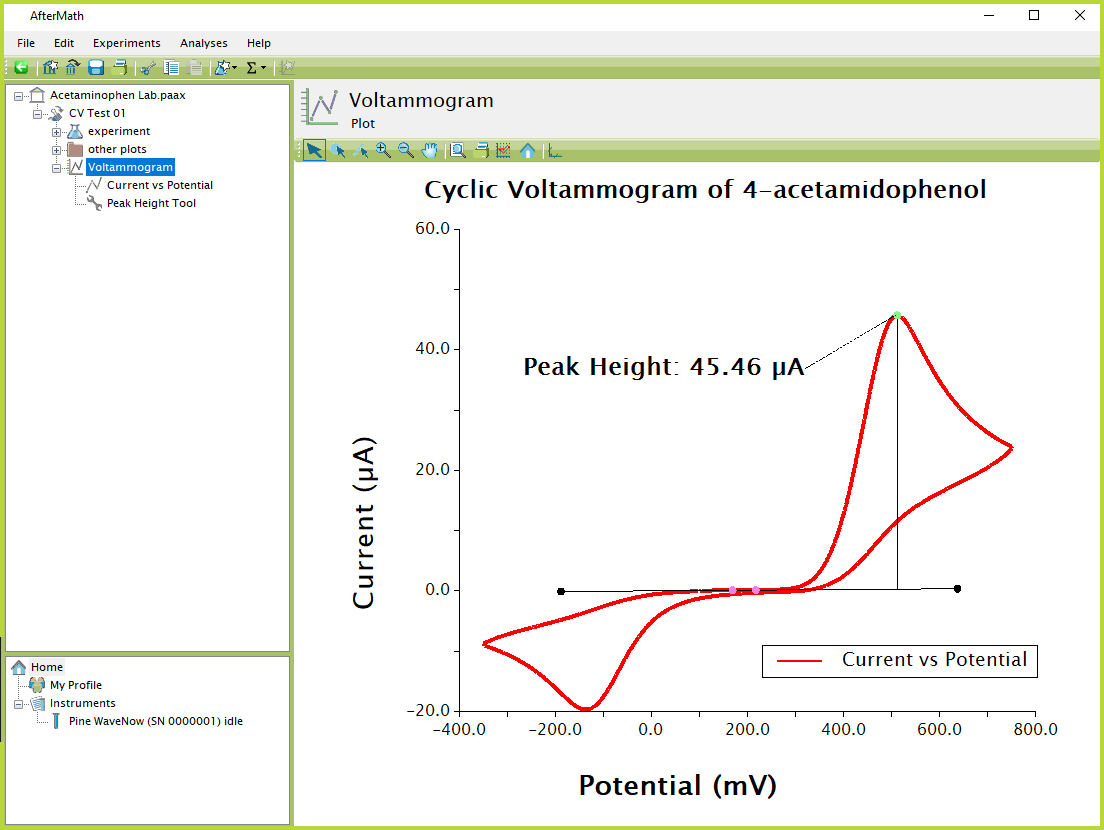
Figure 8. AfterMath Acetaminophen CV
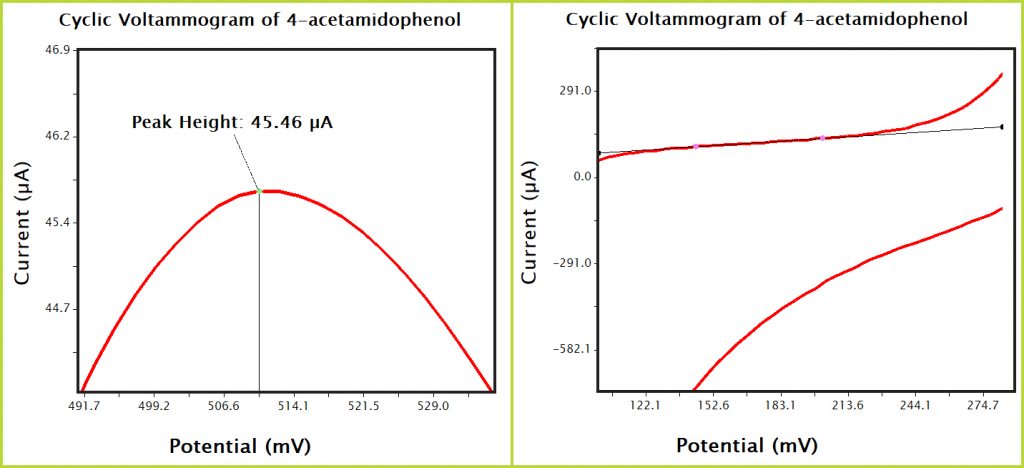
Figure 9. AfterMath Acetaminophen CV Zoomed
6.2Calibration Curve
- Using the anodic peak height data, prepare the calibration curve of peak current versus acetaminophen concentration. This can be done using a piece of graph paper, or more preferably, a spreadsheet program such as Microsoft Excel.
- Use the linear least squares method to fit a straight line to the data on the calibration curve. Calculate the slope and the intercept of best straight line that fits the data, and write down the equation that correlates the peak current with the acetaminophen concentration.
6.3Concentration in Children's Tylenol® Suspension
Using the equation for the best fit line, compute the acetaminophen concentration in the Diluted Medication Test Solution. Next, consider the dilution of the original suspension (values provided to you) during the various preparation steps. After taking these dilutions into account, compute the acetaminophen concentration in the original children’s acetaminophen medication suspension (in grams per liter, using three significant figures).
7Report Questions
- List at least two reasons, outside of your control, that could explain why your result differs from that listed on the manufacturer’s label.
- How would your results have been affected if you had failed to measure the anodic peak current against the proper background baseline?
- Examine the peak height shown in Figure 8. Given that the oxidation of acetaminophen involves the removal of two electrons from the molecule, how many molecules per second must be oxidized in order to produce the observed peak current?
- From your cyclic voltammogram data analysis, compare your determination of acetaminophen concentration with the value given on the label of the commercial medication. Assuming the manufacturer’s label gives the “correct” concentration, what was the percent error in your result?
8References
- Van Benschoten, J. J. ; Lewis, J. Y. ; Heineman, W. R. ; Roston, D. A. ; Kissinger, P. T. Cyclic Voltammetry Experiment. J. Chem. Educ., 1983, 60(9), 772.
- Potter, D. W.; Miller, D. W.; Hinson, J. A. Identification of Acetaminophen Polymerization Products Catalyzed by Horseradish Peroxidase. J. Biol. Chem., 1985, 260(22), 12174-12180.